

The RNA binding protein HuR differentially regulates unique subsets of mRNAs in estrogen receptor negative and estrogen receptor positive breast cancer
- PMID: 20370918
- PMCID: PMC2856550
- DOI: 10.1186/1471-2407-10-126
The RNA binding protein HuR differentially regulates unique subsets of mRNAs in estrogen receptor negative and estrogen receptor positive breast cancer
Abstract
Background: The discordance between steady-state levels of mRNAs and protein has been attributed to posttranscriptional control mechanisms affecting mRNA stability and translation. Traditional methods of genome wide microarray analysis, profiling steady-state levels of mRNA, may miss important mRNA targets owing to significant posttranscriptional gene regulation by RNA binding proteins (RBPs).
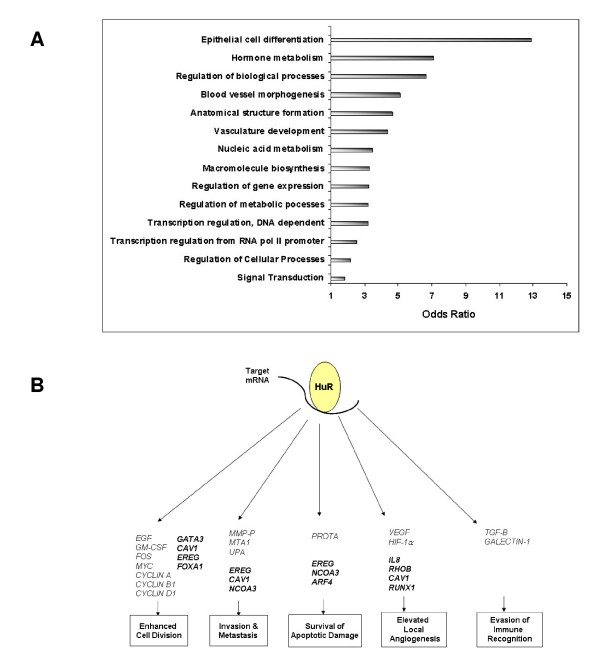
Methods: The ribonomic approach, utilizing RNA immunoprecipitation hybridized to microarray (RIP-Chip), provides global identification of putative endogenous mRNA targets of different RBPs. HuR is an RBP that binds to the AU-rich elements (ARE) of labile mRNAs, such as proto-oncogenes, facilitating their translation into protein. HuR has been shown to play a role in cancer progression and elevated levels of cytoplasmic HuR directly correlate with increased invasiveness and poor prognosis for many cancers, including those of the breast. HuR has been described to control genes in several of the acquired capabilities of cancer and has been hypothesized to be a tumor-maintenance gene, allowing for cancers to proliferate once they are established.
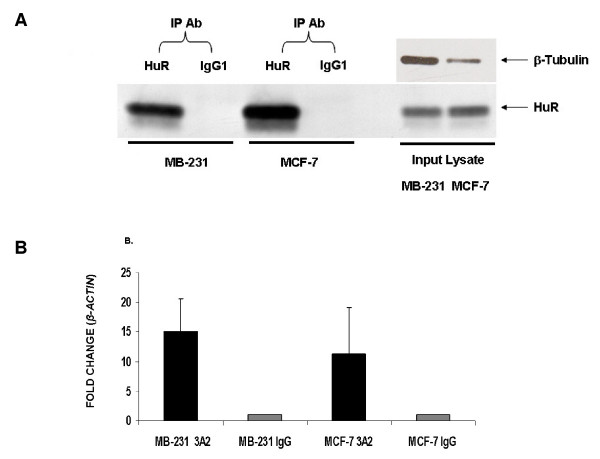
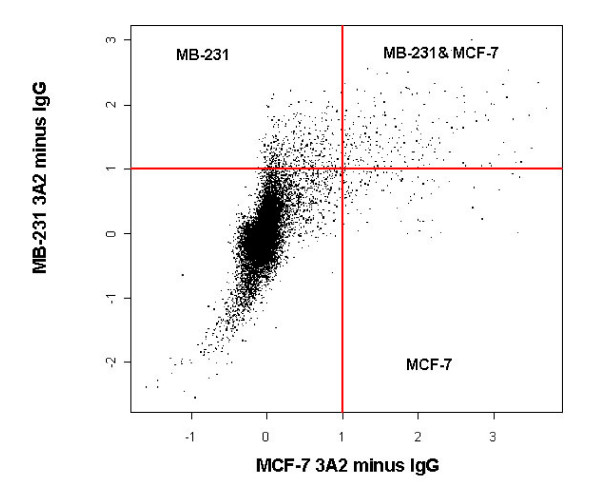
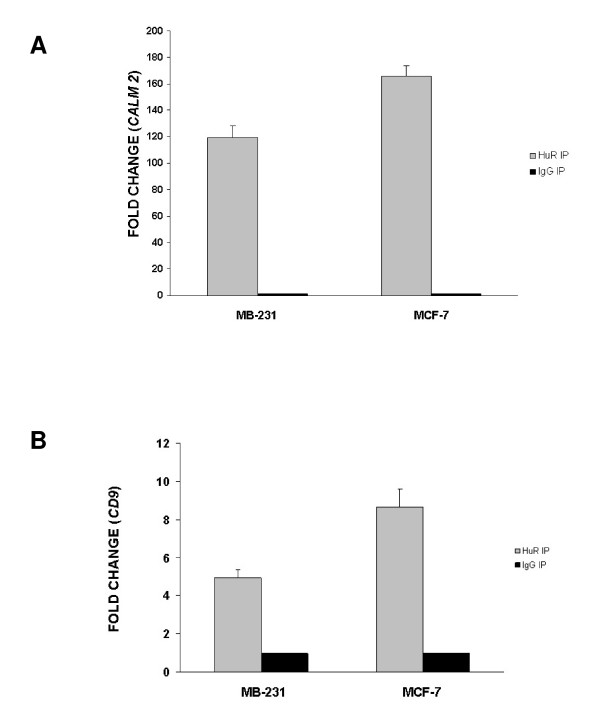
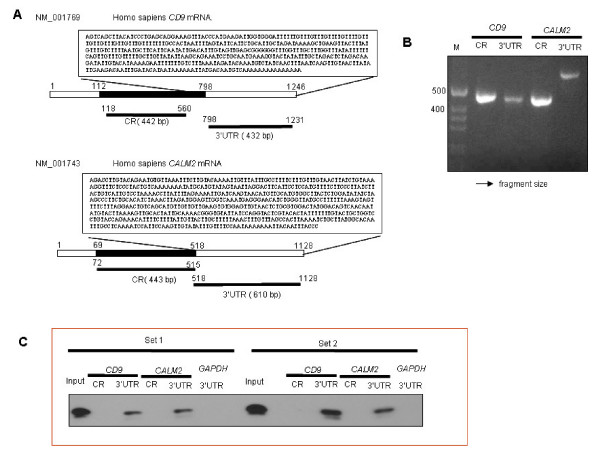
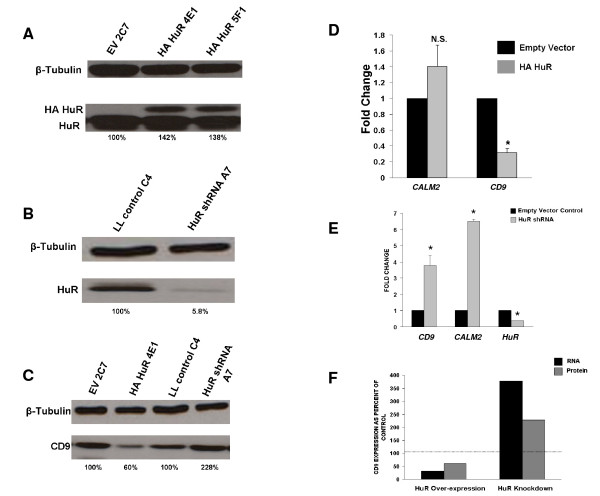
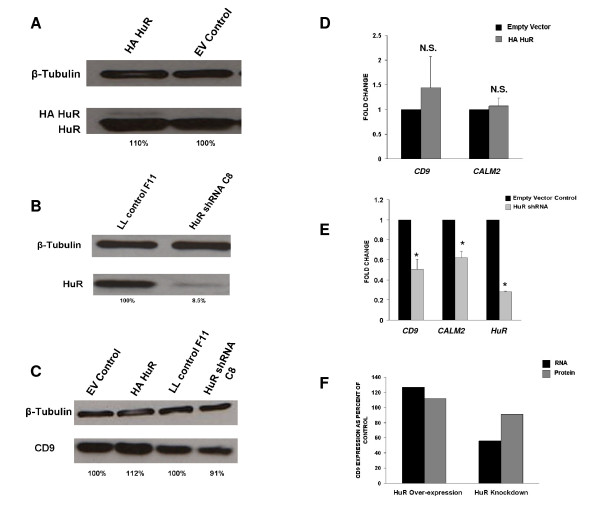
Results: We used HuR RIP-Chip as a comprehensive and systematic method to survey breast cancer target genes in both MCF-7 (estrogen receptor positive, ER+) and MDA-MB-231 (estrogen receptor negative, ER-) breast cancer cell lines. We identified unique subsets of HuR-associated mRNAs found individually or in both cell types. Two novel HuR targets, CD9 and CALM2 mRNAs, were identified and validated by quantitative RT-PCR and biotin pull-down analysis.
Conclusion: This is the first report of a side-by-side genome-wide comparison of HuR-associated targets in wild type ER+ and ER- breast cancer. We found distinct, differentially expressed subsets of cancer related genes in ER+ and ER- breast cancer cell lines, and noted that the differential regulation of two cancer-related genes by HuR was contingent upon the cellular environment.
Figures
Similar articles
-
Overexpression of the RNA binding protein HuR impairs tumor growth in triple negative breast cancer associated with deficient angiogenesis.Cell Cycle. 2010 Aug 15;9(16):3337-46. doi: 10.4161/cc.9.16.12711. Epub 2010 Aug 17. Cell Cycle. 2010. PMID: 20724828 Free PMC article.
-
The RNA-binding protein HuR regulates GATA3 mRNA stability in human breast cancer cell lines.Breast Cancer Res Treat. 2010 Jul;122(1):55-63. doi: 10.1007/s10549-009-0517-8. Epub 2009 Sep 2. Breast Cancer Res Treat. 2010. PMID: 19728080
-
Cytoplasmic accumulation of the RNA binding protein HuR is central to tamoxifen resistance in estrogen receptor positive breast cancer cells.Cancer Biol Ther. 2008 Sep;7(9):1496-506. doi: 10.4161/cbt.7.9.6490. Epub 2008 Sep 23. Cancer Biol Ther. 2008. PMID: 18769129
-
HuR, a key post-transcriptional regulator, and its implication in progression of breast cancer.Histol Histopathol. 2010 Oct;25(10):1331-40. doi: 10.14670/HH-25.1331. Histol Histopathol. 2010. PMID: 20712017 Review.
-
HuR as a molecular target for cancer therapeutics and immune-related disorders.Adv Drug Deliv Rev. 2022 Sep;188:114442. doi: 10.1016/j.addr.2022.114442. Epub 2022 Jul 8. Adv Drug Deliv Rev. 2022. PMID: 35817212 Free PMC article. Review.
Cited by
-
The RNA-Binding Protein HuR in Digestive System Tumors.Biomed Res Int. 2020 Jul 24;2020:9656051. doi: 10.1155/2020/9656051. eCollection 2020. Biomed Res Int. 2020. PMID: 32775456 Free PMC article. Review.
-
Conditional knockout of the RNA-binding protein HuR in CD4⁺ T cells reveals a gene dosage effect on cytokine production.Mol Med. 2014 Mar 20;20(1):93-108. doi: 10.2119/molmed.2013.00127. Mol Med. 2014. PMID: 24477678 Free PMC article.
-
RNA regulons in cancer and inflammation.Curr Opin Genet Dev. 2018 Feb;48:97-103. doi: 10.1016/j.gde.2017.11.004. Epub 2017 Nov 22. Curr Opin Genet Dev. 2018. PMID: 29175729 Free PMC article. Review.
-
RNA-binding protein Rbm47 binds to Nanog in mouse embryonic stem cells.Mol Biol Rep. 2013 Jul;40(7):4391-6. doi: 10.1007/s11033-013-2528-0. Epub 2013 May 7. Mol Biol Rep. 2013. PMID: 23649762
-
GRK2-Dependent HuR Phosphorylation Regulates HIF1α Activation under Hypoxia or Adrenergic Stress.Cancers (Basel). 2020 May 13;12(5):1216. doi: 10.3390/cancers12051216. Cancers (Basel). 2020. PMID: 32413989 Free PMC article.
References
Publication types
MeSH terms
Substances
LinkOut - more resources
Full Text Sources
Other Literature Sources
Medical
Molecular Biology Databases
Miscellaneous
