

Induction patterns of new CYP1 genes in environmentally exposed rainbow trout
- PMID: 20371123
- PMCID: PMC2892734
- DOI: 10.1016/j.aquatox.2010.03.003
Induction patterns of new CYP1 genes in environmentally exposed rainbow trout
Abstract
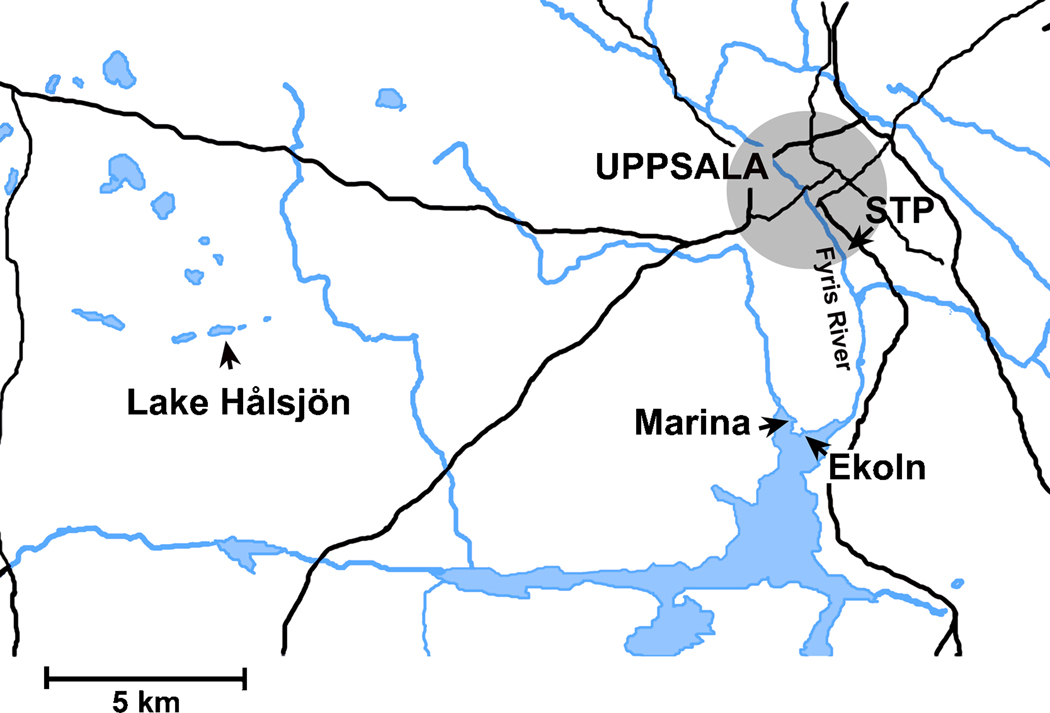
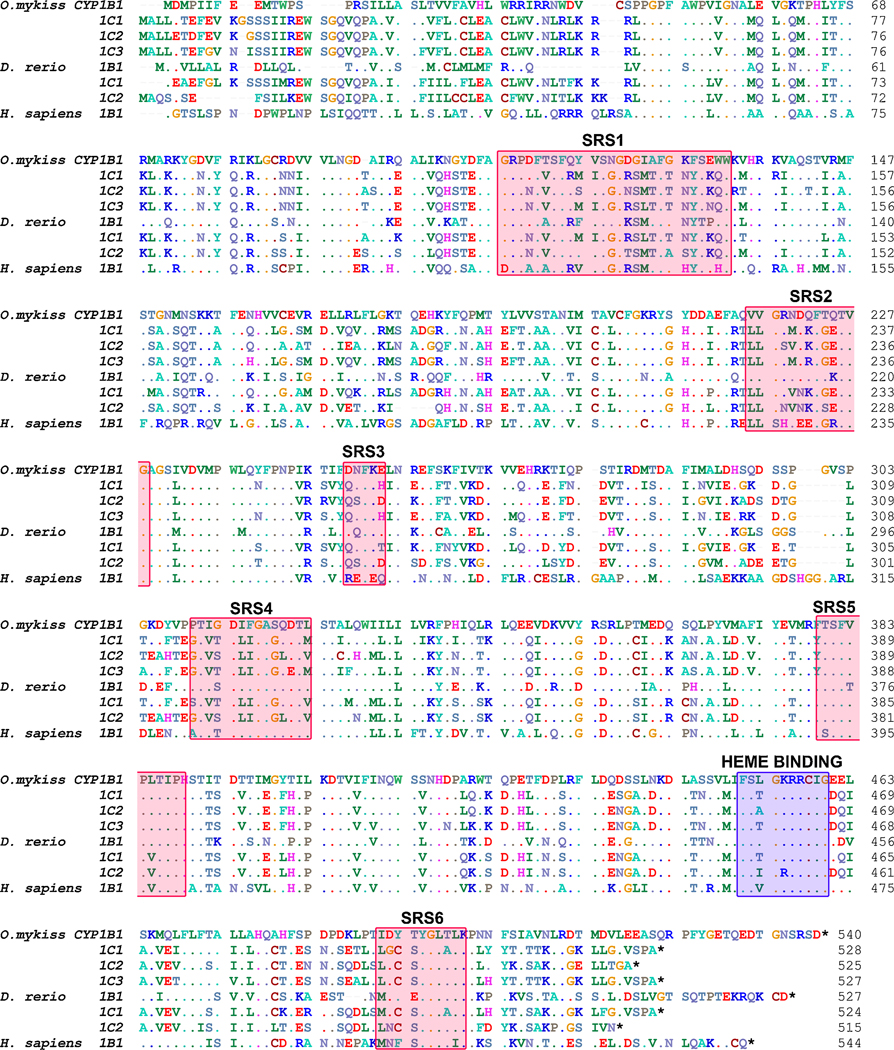
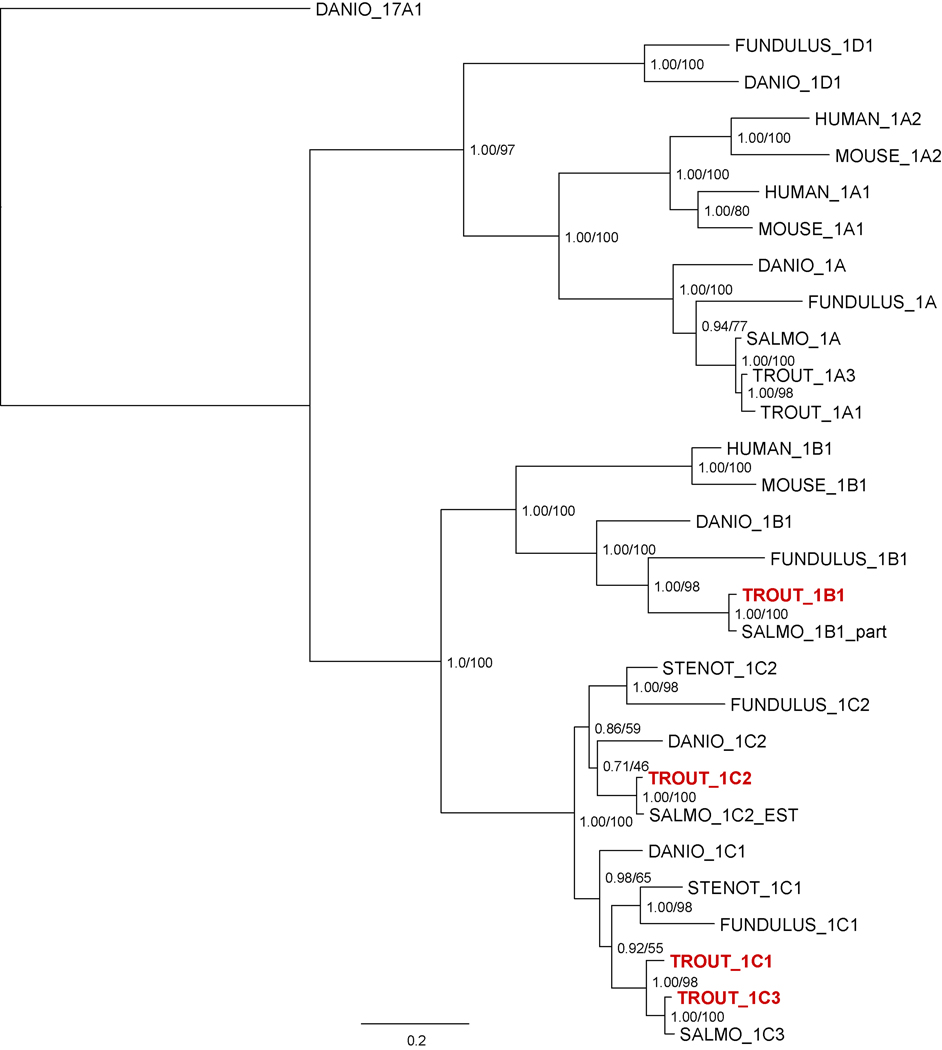
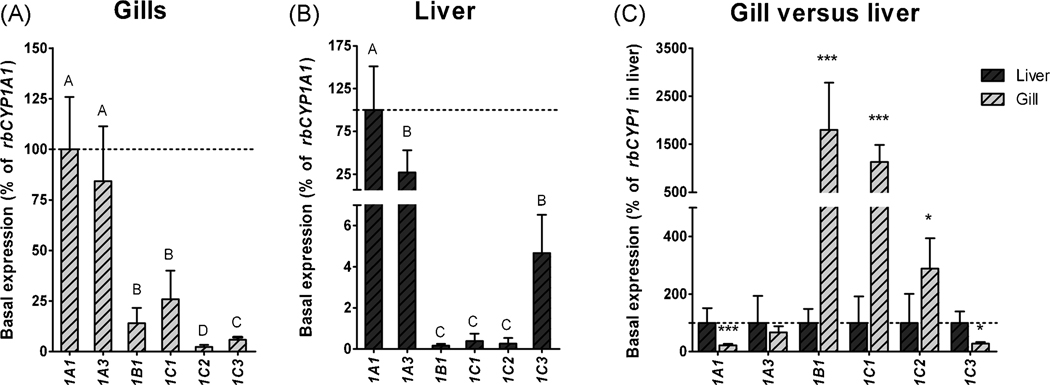
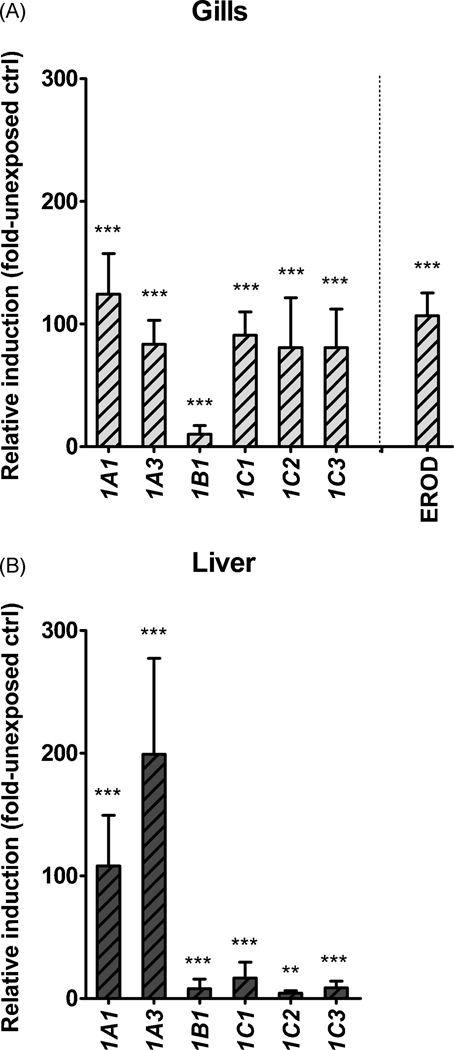
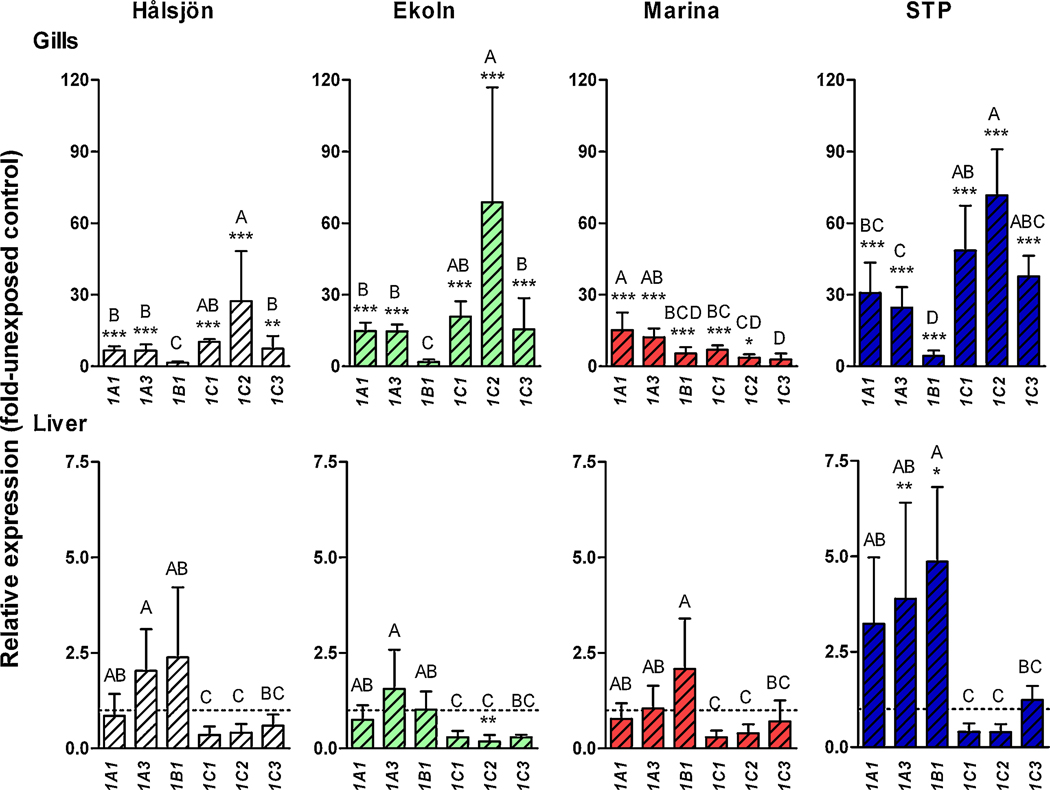
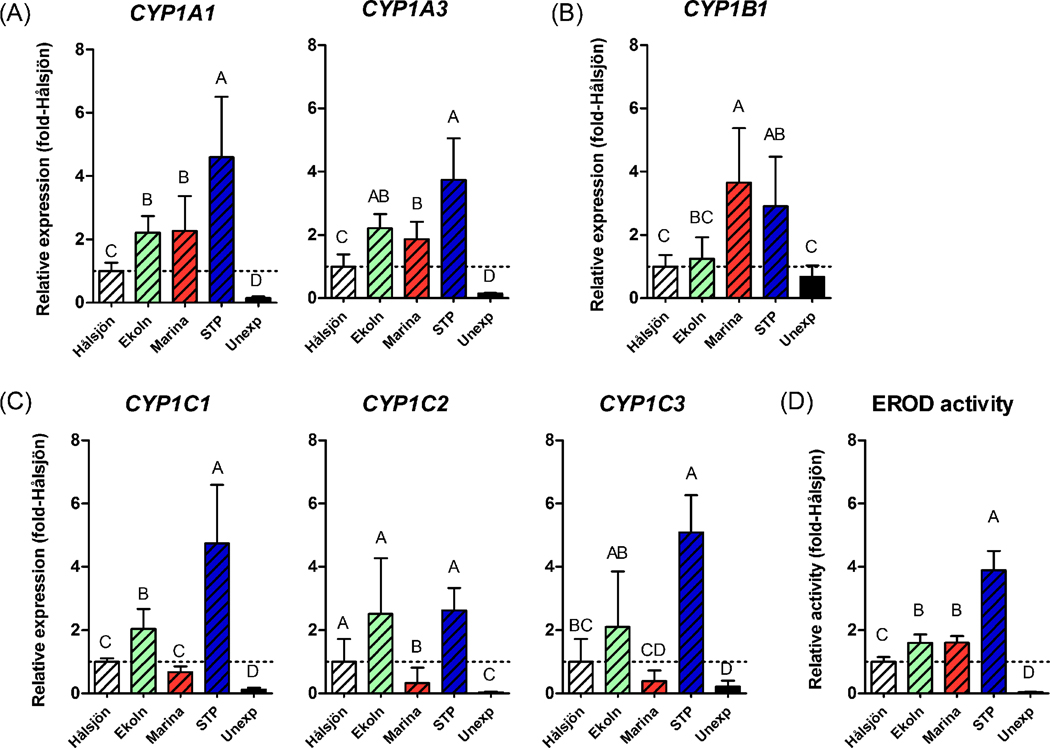
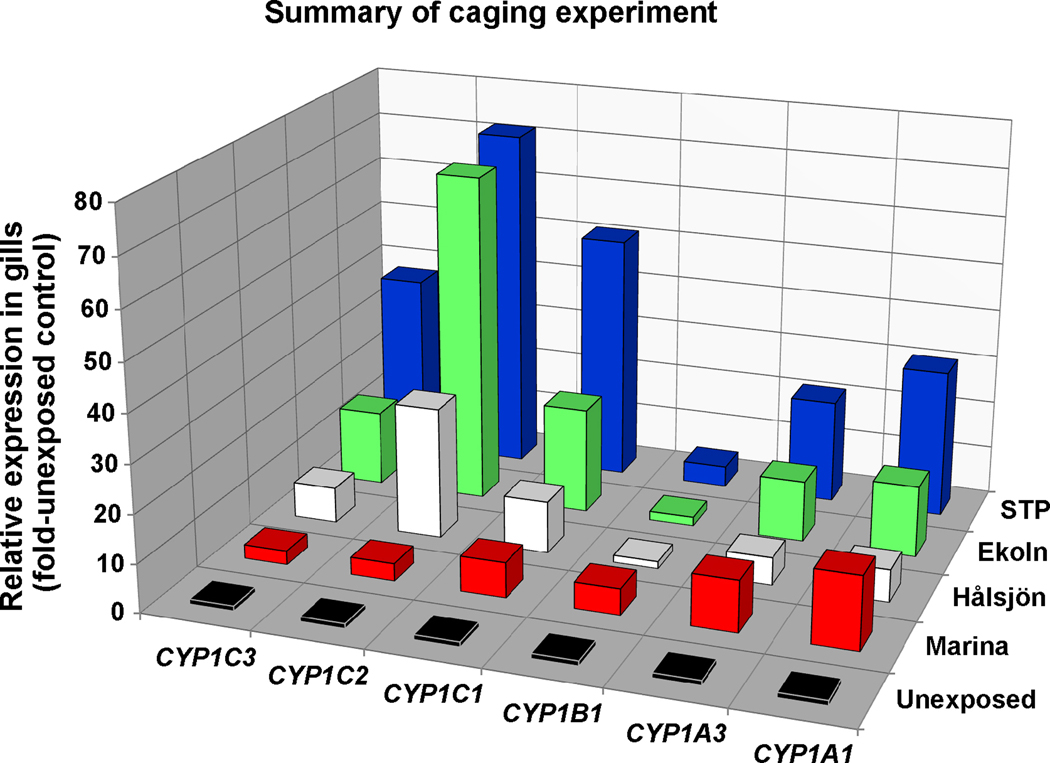
The cytochrome P4501 (CYP1) gene family comprises four subfamilies in fish: CYP1A, CYP1B, CYP1C, and CYP1D. Only two CYP1 genes, CYP1A1 and CYP1A3, are so far known in rainbow trout (Oncorhynchus mykiss). The present study aimed to identify other CYP1 subfamily genes in rainbow trout, to establish methods for quantitative mRNA expression analysis of these genes, and to determine their basal and induced mRNA expression in gills and liver. Another goal was to examine their mRNA expression in environmentally exposed fish. We cloned four new transcripts, denoted rbCYP1B1, rbCYP1C1, rbCYP1C2, and rbCYP1C3. Levels of these and the previously known rbCYP1A transcripts were determined by real-time PCR in unexposed fish, fish exposed to the potent aryl hydrocarbon receptor (AhR) agonist 3,3',4,4',5-pentachlorobiphenyl (PCB126), and fish caged in various waters in the Uppsala region (Sweden). The mRNA expression patterns observed in unexposed rainbow trout (basal levels) were markedly similar to those reported for orthologous genes in other species. All six transcripts were induced by PCB126 in gills and liver, suggesting all genes to be AhR regulated. The caged fish showed clear rbCYP1 induction in gills at all monitoring sites (up to 70-fold the basal level), whereas the liver responses were weak; induction (up to 5-fold) was recorded only at the Uppsala municipal sewage treatment plant outlet. Gill filament EROD activity was induced at all caging sites. Most interestingly, the rbCYP1 gene response patterns in gills differed among caging sites and among subfamilies. The EROD induction seemed to only reflect induction of rbCYP1A transcription. Response patterns of multiple CYP1 genes in gills and liver could provide an improved monitoring strategy. Such patterns could be used to characterize complex mixtures of AhR agonists and antagonists in aquatic environments.
Copyright (c) 2010 Elsevier B.V. All rights reserved.
Figures
Similar articles
-
Cytochrome P450 1A, 1B, and 1C mRNA induction patterns in three-spined stickleback exposed to a transient and a persistent inducer.Comp Biochem Physiol C Toxicol Pharmacol. 2011 Jun;154(1):42-55. doi: 10.1016/j.cbpc.2011.02.005. Epub 2011 Feb 25. Comp Biochem Physiol C Toxicol Pharmacol. 2011. PMID: 21354474 Free PMC article.
-
Gill EROD in monitoring of CYP1A inducers in fish: a study in rainbow trout (Oncorhynchus mykiss) caged in Stockholm and Uppsala waters.Aquat Toxicol. 2007 Nov 15;85(1):1-8. doi: 10.1016/j.aquatox.2007.07.013. Epub 2007 Aug 2. Aquat Toxicol. 2007. PMID: 17826851
-
Cytochrome P4501A induction in rainbow trout gills and liver following exposure to waterborne indigo, benzo[a]pyrene and 3,3',4,4',5-pentachlorobiphenyl.Aquat Toxicol. 2006 Sep 12;79(3):226-32. doi: 10.1016/j.aquatox.2006.06.006. Epub 2006 Jul 26. Aquat Toxicol. 2006. PMID: 16872689
-
[Application of Rainbow Trout CYP1 Gene Expression Patterns in Gill and Liver for Haihe River Bio-monitoring].Huan Jing Ke Xue. 2015 Oct;36(10):3878-83. Huan Jing Ke Xue. 2015. PMID: 26841626 Chinese.
-
Role of AHR2 in the expression of novel cytochrome P450 1 family genes, cell cycle genes, and morphological defects in developing zebra fish exposed to 3,3',4,4',5-pentachlorobiphenyl or 2,3,7,8-tetrachlorodibenzo-p-dioxin.Toxicol Sci. 2007 Nov;100(1):180-93. doi: 10.1093/toxsci/kfm207. Epub 2007 Aug 8. Toxicol Sci. 2007. PMID: 17686920
Cited by
-
Xenobiotic metabolism and its physiological consequences in high-Antarctic Notothenioid fishes.Polar Biol. 2022;45(2):345-358. doi: 10.1007/s00300-021-02992-4. Epub 2021 Dec 26. Polar Biol. 2022. PMID: 35221461 Free PMC article.
-
New CYP1 genes in the frog Xenopus (Silurana) tropicalis: induction patterns and effects of AHR agonists during development.Toxicol Appl Pharmacol. 2011 Jan 15;250(2):170-83. doi: 10.1016/j.taap.2010.10.010. Epub 2010 Oct 18. Toxicol Appl Pharmacol. 2011. PMID: 20965207 Free PMC article.
-
Cytochrome P450 1A, 1B, and 1C mRNA induction patterns in three-spined stickleback exposed to a transient and a persistent inducer.Comp Biochem Physiol C Toxicol Pharmacol. 2011 Jun;154(1):42-55. doi: 10.1016/j.cbpc.2011.02.005. Epub 2011 Feb 25. Comp Biochem Physiol C Toxicol Pharmacol. 2011. PMID: 21354474 Free PMC article.
-
Differential transcription of heat shock protein 90 (HSP90) in the dinoflagellate Prorocentrum minimum by copper and endocrine-disrupting chemicals.Ecotoxicology. 2012 Jul;21(5):1448-57. doi: 10.1007/s10646-012-0898-z. Epub 2012 Apr 4. Ecotoxicology. 2012. PMID: 22476698
-
Basal and 3-methylcholanthrene-induced expression of cytochrome P450 1A, 1B and 1C genes in the Brazilian guppy, Poecilia vivipara.Aquat Toxicol. 2012 Nov 15;124-125:106-13. doi: 10.1016/j.aquatox.2012.08.006. Epub 2012 Aug 14. Aquat Toxicol. 2012. PMID: 22940225 Free PMC article.
References
-
- Abrahamson A, Andersson C, Jönsson ME, Fogelberg O, Örberg J, Brunström B, Brandt I. Gill EROD in monitoring of CYP1A inducers in fish: a study in rainbow trout (Oncorhynchus mykiss) caged in Stockholm and Uppsala waters. Aquat. Toxicol. 2007;85:1–8. - PubMed
-
- Allendorf FW, Thorgaard GH. Tetraploidy and the evolution of salmonid fishes. In: Turner BJ, editor. The Evolutionary Genetics of Fishes. New York: Plenum Press; 1984. pp. 1–53.
-
- Andersson T, Pärt P. Benzo[a]pyrene metabolism in isolated perfused rainbow trout gills. Mar. Environ. Res. 1989;28:3–7.
Publication types
MeSH terms
Substances
Grants and funding
LinkOut - more resources
Full Text Sources
