

Collision-based spiral acceleration in cardiac media: roles of wavefront curvature and excitable gap
- PMID: 20371311
- PMCID: PMC2849081
- DOI: 10.1016/j.bpj.2009.12.4281
Collision-based spiral acceleration in cardiac media: roles of wavefront curvature and excitable gap
Abstract
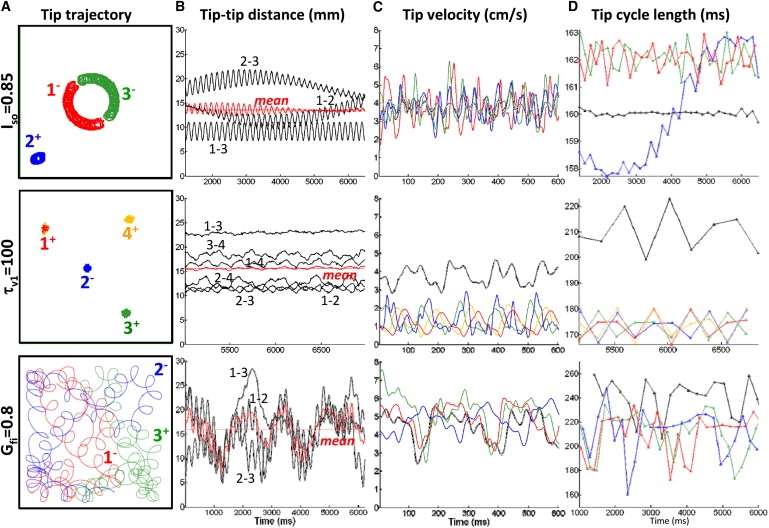
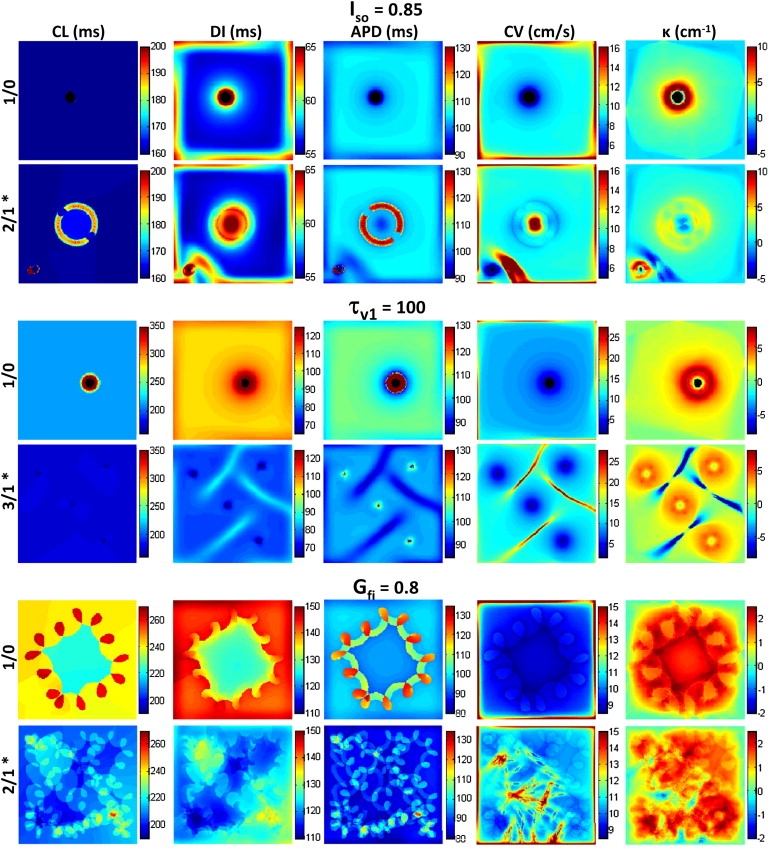
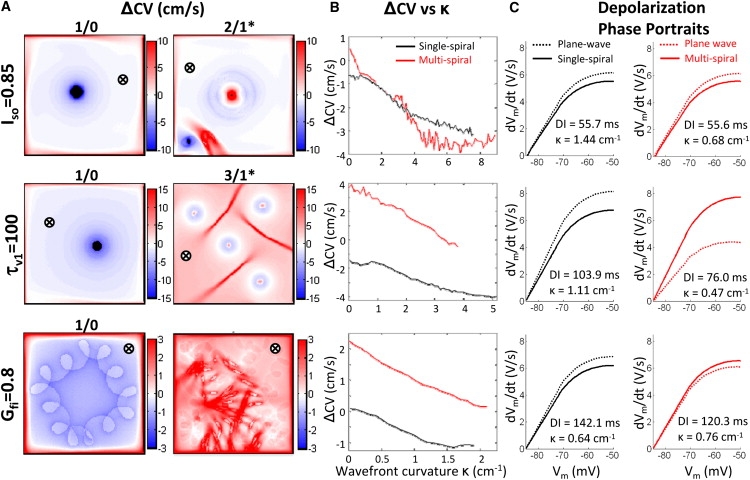
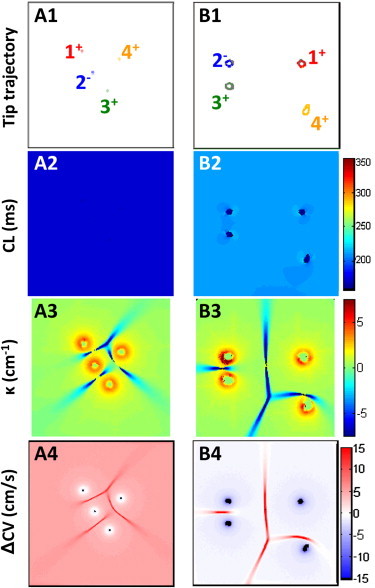
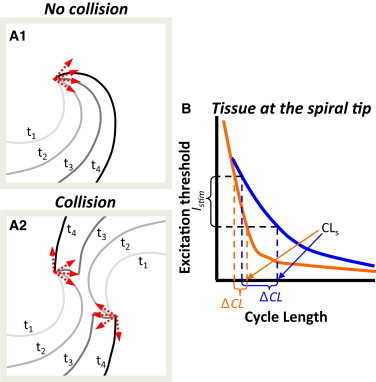
We have previously shown in experimental cardiac cell monolayers that rapid point pacing can convert basic functional reentry (single spiral) into a stable multiwave spiral that activates the tissue at an accelerated rate. Here, our goal is to further elucidate the biophysical mechanisms of this rate acceleration without the potential confounding effects of microscopic tissue heterogeneities inherent to experimental preparations. We use computer simulations to show that, similar to experimental observations, single spirals can be converted by point stimuli into stable multiwave spirals. In multiwave spirals, individual waves collide, yielding regions with negative wavefront curvature. When a sufficient excitable gap is present and the negative-curvature regions are close to spiral tips, an electrotonic spread of excitatory currents from these regions propels each colliding spiral to rotate faster than the single spiral, causing an overall rate acceleration. As observed experimentally, the degree of rate acceleration increases with the number of colliding spiral waves. Conversely, if collision sites are far from spiral tips, excitatory currents have no effect on spiral rotation and multiple spirals rotate independently, without rate acceleration. Understanding the mechanisms of spiral rate acceleration may yield new strategies for preventing the transition from monomorphic tachycardia to polymorphic tachycardia and fibrillation.
Copyright (c) 2010 Biophysical Society. Published by Elsevier Inc. All rights reserved.
Figures
Similar articles
-
Induced spiral motion in cardiac tissue due to alternans.Phys Rev E Stat Nonlin Soft Matter Phys. 2012 Dec;86(6 Pt 1):061908. doi: 10.1103/PhysRevE.86.061908. Epub 2012 Dec 17. Phys Rev E Stat Nonlin Soft Matter Phys. 2012. PMID: 23367977
-
Multiarm spirals in a two-dimensional cardiac substrate.Proc Natl Acad Sci U S A. 2004 Oct 26;101(43):15530-4. doi: 10.1073/pnas.0400984101. Epub 2004 Oct 18. Proc Natl Acad Sci U S A. 2004. PMID: 15492227 Free PMC article.
-
Formation of fast spirals on heterogeneities of an excitable medium.Phys Rev E Stat Nonlin Soft Matter Phys. 2008 Jul;78(1 Pt 1):012901. doi: 10.1103/PhysRevE.78.012901. Epub 2008 Jul 22. Phys Rev E Stat Nonlin Soft Matter Phys. 2008. PMID: 18764001
-
Of circles and spirals: bridging the gap between the leading circle and spiral wave concepts of cardiac reentry.Europace. 2005 Sep;7 Suppl 2:10-20. doi: 10.1016/j.eupc.2005.05.011. Europace. 2005. PMID: 16102499 Review.
-
Basic mechanisms of cardiac impulse propagation and associated arrhythmias.Physiol Rev. 2004 Apr;84(2):431-88. doi: 10.1152/physrev.00025.2003. Physiol Rev. 2004. PMID: 15044680 Review.
Cited by
-
Propagating Neural Source Revealed by Doppler Shift of Population Spiking Frequency.J Neurosci. 2016 Mar 23;36(12):3495-505. doi: 10.1523/JNEUROSCI.3525-15.2016. J Neurosci. 2016. PMID: 27013678 Free PMC article.
-
Microheterogeneity-induced conduction slowing and wavefront collisions govern macroscopic conduction behavior: A computational and experimental study.PLoS Comput Biol. 2018 Jul 16;14(7):e1006276. doi: 10.1371/journal.pcbi.1006276. eCollection 2018 Jul. PLoS Comput Biol. 2018. PMID: 30011279 Free PMC article.
References
-
- Davidenko J.M., Pertsov A.V., Jalife J. Stationary and drifting spiral waves of excitation in isolated cardiac muscle. Nature. 1992;355:349–351. - PubMed
-
- Jalife J. Ventricular fibrillation: mechanisms of initiation and maintenance. Annu. Rev. Physiol. 2000;62:25–50. - PubMed
-
- Weiss J.N. Factors determining the transition from ventricular tachycardia to ventricular fibrillation. Heart Rhythm. 2005;2:1008–1010. - PubMed
-
- Ashihara T., Yao T., Ito M. Afterdepolarizations promote the transition from ventricular tachycardia to fibrillation in a three-dimensional model of cardiac tissue. Circ. J. 2002;66:505–510. - PubMed
-
- Huffaker R.B., Weiss J.N., Kogan B. Effects of early afterdepolarizations on reentry in cardiac tissue: a simulation study. Am. J. Physiol. Heart Circ. Physiol. 2007;292:H3089–H3102. - PubMed
Publication types
MeSH terms
Grants and funding
LinkOut - more resources
Full Text Sources
Medical
Research Materials
Miscellaneous
