

Alternans resonance and propagation block during supernormal conduction in cardiac tissue with decreased [K(+)](o)
- PMID: 20371312
- PMCID: PMC2849079
- DOI: 10.1016/j.bpj.2009.12.4280
Alternans resonance and propagation block during supernormal conduction in cardiac tissue with decreased [K(+)](o)
Abstract
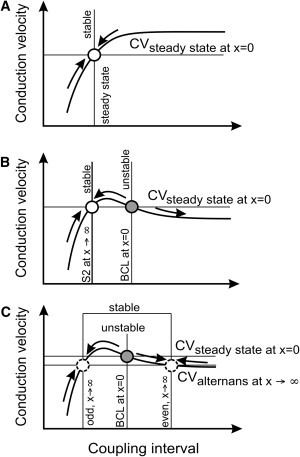
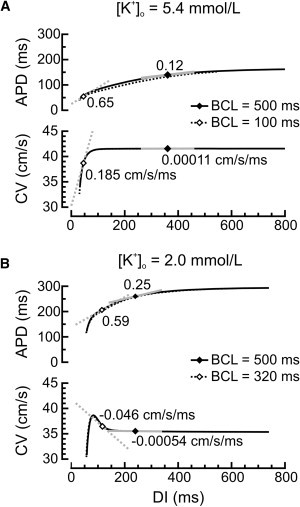
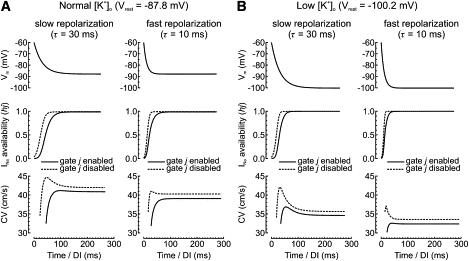
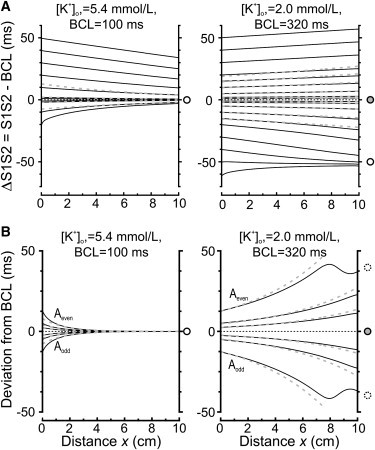
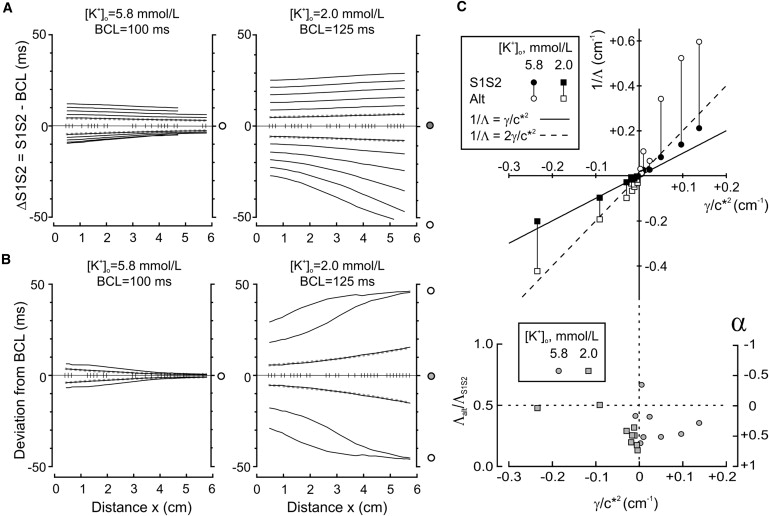
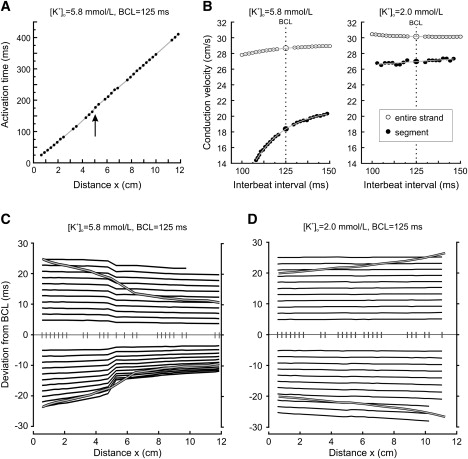
Cardiac restitution is an important factor in arrhythmogenesis. Steep positive action potential duration and conduction velocity (CV) restitution slopes promote alternans and reentrant arrhythmias. We examined the consequences of supernormal conduction (characterized by a negative CV restitution slope) on patterns of conduction and alternans in strands of Luo-Rudy model cells and in cultured cardiac cell strands. Interbeat intervals (IBIs) were analyzed as a function of distance during S1S2 protocols and during pacing at alternating cycle lengths. Supernormal conduction was induced by decreasing [K(+)](o). In control [K(+)](o) simulations, S1S2 intervals converged toward basic cycle length with a length constant determined by both CV and the CV restitution slope. During alternant pacing, the amplitude of IBI alternans converged with a shorter length constant, determined also by the action potential duration restitution slope. In contrast, during supernormal conduction, S1S2 intervals and the amplitude of alternans diverged. This amplification (resonance) led to phase-locked or more complex alternans patterns, and then to distal conduction block. The convergence/divergence of IBIs was verified in the cultured strands, in which naturally occurring tissue heterogeneities resulted in prominent discontinuities of the spatial IBI profiles. We conclude that supernormal conduction potentiates alternans and spatial analysis of IBIs represents a powerful method to locate tissue heterogeneities.
Copyright (c) 2010 Biophysical Society. Published by Elsevier Inc. All rights reserved.
Figures
Similar articles
-
The transfer functions of cardiac tissue during stochastic pacing.Biophys J. 2009 Jan;96(1):294-311. doi: 10.1016/j.bpj.2008.09.025. Biophys J. 2009. PMID: 19134481 Free PMC article.
-
The role of short term memory and conduction velocity restitution in alternans formation.J Theor Biol. 2015 Feb 21;367:21-28. doi: 10.1016/j.jtbi.2014.11.014. Epub 2014 Nov 27. J Theor Biol. 2015. PMID: 25435411
-
Spatially discordant alternans in cardiomyocyte monolayers.Am J Physiol Heart Circ Physiol. 2008 Mar;294(3):H1417-25. doi: 10.1152/ajpheart.01233.2007. Epub 2008 Jan 25. Am J Physiol Heart Circ Physiol. 2008. PMID: 18223190
-
Mechanisms of arrythmogenic cardiac alternans.Europace. 2007 Nov;9 Suppl 6:vi77-82. doi: 10.1093/europace/eum210. Europace. 2007. PMID: 17959697 Review.
-
Developing a novel comprehensive framework for the investigation of cellular and whole heart electrophysiology in the in situ human heart: historical perspectives, current progress and future prospects.Prog Biophys Mol Biol. 2014 Aug;115(2-3):252-60. doi: 10.1016/j.pbiomolbio.2014.06.004. Epub 2014 Jun 24. Prog Biophys Mol Biol. 2014. PMID: 24972083 Review.
Cited by
-
Dynamics of spatiotemporal line defects and chaos control in complex excitable systems.Sci Rep. 2017 Aug 10;7(1):7757. doi: 10.1038/s41598-017-08011-z. Sci Rep. 2017. PMID: 28798384 Free PMC article.
-
Computational approaches to understand cardiac electrophysiology and arrhythmias.Am J Physiol Heart Circ Physiol. 2012 Oct 1;303(7):H766-83. doi: 10.1152/ajpheart.01081.2011. Epub 2012 Aug 10. Am J Physiol Heart Circ Physiol. 2012. PMID: 22886409 Free PMC article. Review.
-
Phase Relationship between Alternans of Early and Late Phases of Ventricular Action Potentials.Front Physiol. 2012 Jun 8;3:190. doi: 10.3389/fphys.2012.00190. eCollection 2012. Front Physiol. 2012. PMID: 22701104 Free PMC article.
-
Myofibroblasts Electrotonically Coupled to Cardiomyocytes Alter Conduction: Insights at the Cellular Level from a Detailed In silico Tissue Structure Model.Front Physiol. 2016 Oct 27;7:496. doi: 10.3389/fphys.2016.00496. eCollection 2016. Front Physiol. 2016. PMID: 27833567 Free PMC article.
-
Titanium dioxide nanoparticles promote arrhythmias via a direct interaction with rat cardiac tissue.Part Fibre Toxicol. 2014 Dec 9;11:63. doi: 10.1186/s12989-014-0063-3. Part Fibre Toxicol. 2014. PMID: 25487314 Free PMC article.
References
-
- Nolasco J.B., Dahlen R.W. A graphic method for the study of alternation in cardiac action potentials. J. Appl. Physiol. 1968;25:191–196. - PubMed
-
- Riccio M.L., Koller M.L., Gilmour R.F., Jr. Electrical restitution and spatiotemporal organization during ventricular fibrillation. Circ. Res. 1999;84:955–963. - PubMed
-
- Samie F.H., Berenfeld O., Jalife J. Rectification of the background potassium current: a determinant of rotor dynamics in ventricular fibrillation. Circ. Res. 2001;89:1216–1223. - PubMed
-
- Weiss J.N., Qu Z., Karma A. The dynamics of cardiac fibrillation. Circulation. 2005;112:1232–1240. - PubMed
-
- Weiss J.N., Karma A., Qu Z. From pulsus to pulseless: the saga of cardiac alternans. Circ. Res. 2006;98:1244–1253. - PubMed
Publication types
MeSH terms
LinkOut - more resources
Full Text Sources
Medical
