. 2010 Apr 7;98(7):1149-59.
doi: 10.1016/j.bpj.2009.11.032.

Phospholemman modulates the gating of cardiac L-type calcium channels

Affiliations

Phospholemman modulates the gating of cardiac L-type calcium channels

Xianming Wang et al. Biophys J. .

Abstract

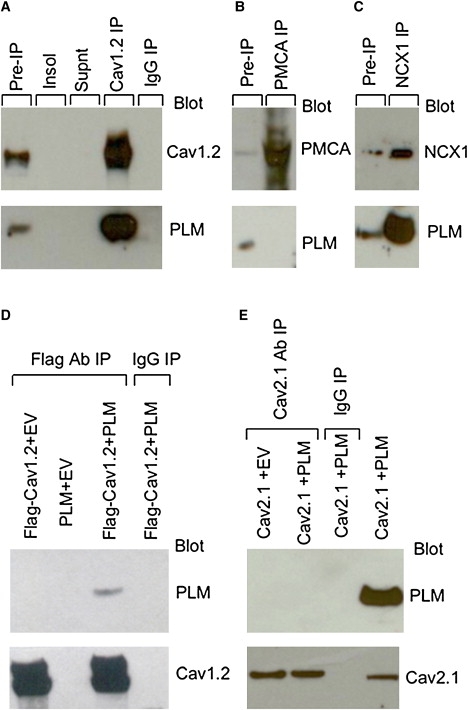
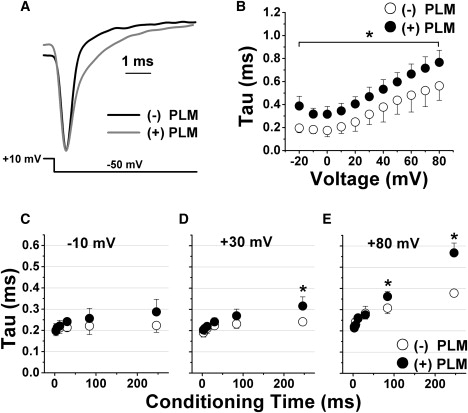
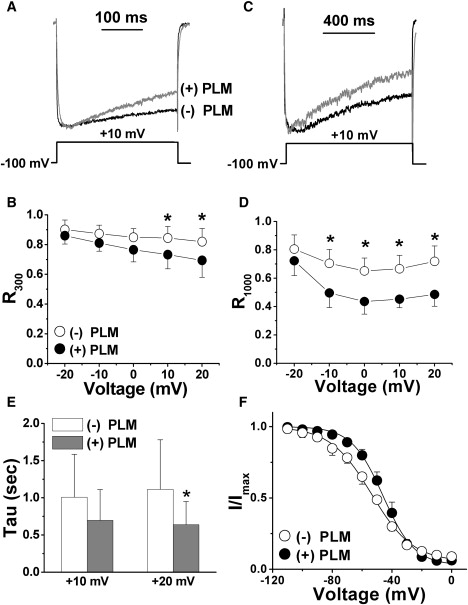
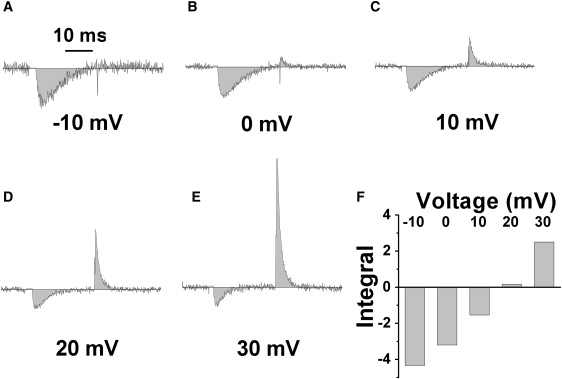
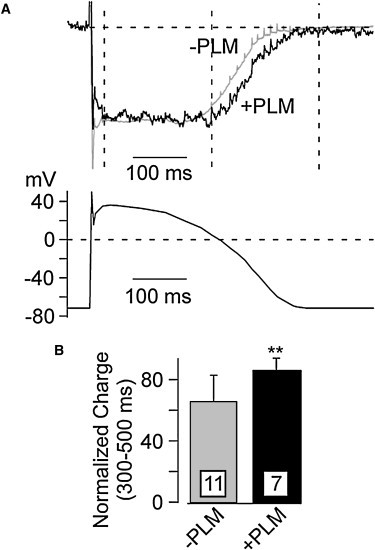
Ca(2+) entry through L-type calcium channels (Ca(V)1.2) is critical in shaping the cardiac action potential and initiating cardiac contraction. Modulation of Ca(V)1.2 channel gating directly affects myocyte excitability and cardiac function. We have found that phospholemman (PLM), a member of the FXYD family and regulator of cardiac ion transport, coimmunoprecipitates with Ca(V)1.2 channels from guinea pig myocytes, which suggests PLM is an endogenous modulator. Cotransfection of PLM in HEK293 cells slowed Ca(V)1.2 current activation at voltages near the threshold for activation, slowed deactivation after long and strong depolarizing steps, enhanced the rate and magnitude of voltage-dependent inactivation (VDI), and slowed recovery from inactivation. However, Ca(2+)-dependent inactivation was not affected. Consistent with slower channel closing, PLM significantly increased Ca(2+) influx via Ca(V)1.2 channels during the repolarization phase of a human cardiac action potential waveform. Our results support PLM as an endogenous regulator of Ca(V)1.2 channel gating. The enhanced VDI induced by PLM may help protect the heart under conditions such as ischemia or tachycardia where the channels are depolarized for prolonged periods of time and could induce Ca(2+) overload. The time and voltage-dependent slowed deactivation could represent a gating shift that helps maintain Ca(2+) influx during the cardiac action potential waveform plateau phase.


Figures

Figure 1
Figure 1
Association of PLM with native and exogenously expressed CaV1.2 channels. IP experiments were carried out on solubilized membranes derived from (AC) guinea pig ventricular myocytes and (D and E) HEK 293 cell lysates using (A) anti-CaV1.2, (B, negative control) anti-PMCA antibody, (C, positive control) anti-NCX1, (D) Anti-Flag, and (E) anti-CaV2.1 antibodies. (AC) Control lanes: Pre-IP: solubilized protein before IP; Insol: insoluble protein removed by centrifugation; Supnt: supernatant after IP; IgG: IgG control. Blots were probed with antibodies against PLM (lower panels) and CaV1.2, PMCA or NCX, as indicated (upper panels). (D) IP experiments carried out on lysates prepared from HEK293cells expressing CaV1.2, PLM or both as indicated using mouse monoclonal anti-Flag antibody (lanes 13) or mouse pre-immune IgG (lane 4), followed by immunoblot analysis using antibodies against PLM (upper panel) and CaV1.2 (lower panel). (E) Similar to D, except cells were transfected with cDNAs encoding CaV2.1, PLM, or both and IP was carried out using antibodies against CaV2.1.
Figure 2
Figure 2
PLM alters the kinetics and voltage-dependence of CaV1.2 channel activation. Ba2+ currents evoked by 25 ms depolarizing steps to −10 mV in the absence ((−)PLM; black) and presence ((+)PLM; gray) for (A) CaV1.2 and (D) CaV2.1 channels were normalized to current amplitudes measured at the end of each step. Current-voltage relationships were generated ± PLM by a series of 25 ms step pulses ranging from −60 to +50 mV from a holding potential of −100 mV for (B) CaV1.2 and (E) CaV2.1. Steady-state activation curves measured from tail currents are left-shifted in the presence of PLM for (C) CaV1.2, but not (F) CaV2.1 channels. Tail currents were measured at −50 mV after a series of 25 ms step pulse 5 from −100 to +100 mV, and the data were fitted with a Boltzmann equation (smooth lines) to generate the half activation voltage (Vh) and slope factor (k). For CaV1.2: Vh = 25.0 ± 2.2 mV and k = 23.3 ± 1.57 for (−) PLM and Vh = 4.1 ± 0.95 mV and k = 12.9 ± 0.81 for (+)PLM. Vh and k for CaV1.2 (but not CaV2.1) currents are significantly different when measured in the absence and presence of PLM (p < 0.05, n = 9).
Figure 3
Figure 3
PLM slows activation of CaV1.2 channels. (A) Ba2+ currents ± PLM were generated by 150 ms voltage steps to −20, 0, and +20 mV from a holding potential of −100 mV. Slowing of activation is pronounced at −20 and 0 mV and modest at +20 mV in the presence of PLM. (B) The time required for channels to activate from 10 to 90% of the maximum is plotted versus step voltage ± PLM. t10–90 is significantly increased in the presence of PLM at −20 and −10 mV (p < 0.05, n = 9–12).
Figure 4
Figure 4
PLM slows deactivation of CaV1.2 channels. (A) Sample tail currents recorded in Ba2+ at −50 mV are shown after a 100 ms step to +10 mV. (B) Rate of deactivation ± PLM was evaluated using single exponential fits of tail currents recorded following voltage steps from −20 to +80 mV. Values of τ versus voltage plots indicate that PLM slows deactivation at all voltages tested (asterisk) (n = 5). (CE) The development of slowed deactivation was evaluated using standard envelope protocol in the absence and presence of PLM. Cells were stepped to (C) −10, (D) +30, and (E) +80 mV with various durations (0–250 ms) followed by repolarizing steps to −50 mV. Tails currents were assessed using single exponential fits as described in B to determine voltage and time dependent values for τ. Significant differences between (−) and (+) PLM are indicated by an asterisk (n = 4–5).
Figure 5
Figure 5
PLM enhances VDI of CaV1.2 channels. Ba2+ currents recorded in the absence and presence of PLM were generated by either (A) 300 or (C) 1000 ms depolarizing steps to +10 mV in 10 mM Ba2+. PLM speeds the rate of inactivation (A and C) and increases the fraction of inactivating channels at 300 and 1000 ms. (B and D) The R300 and R1000 values were determined by measuring the fraction of current remaining at the end of (B) 300 ms (R300) or (D) 1000 ms (R1000) voltage steps. Significantly different values between (−)PLM and (+)PLM are indicated by an asterisk (p < 0.05). R300 values are averaged from 13 cells whereas 12–14 cells were used for the R1000 values. (E) Single exponential fits through currents evoked by 1000 ms voltage steps to either +10 or +20 mV indicates that PLM significantly speeds the kinetics for inactivation (τ) at +20 mV (p < 0.05). (F) A standard three-pulse protocol consisting of two 150-ms test pulses to 0 mV (pre- and postpulse) bracketing 30-s steps to voltages ranging from −110 to 0 mV was used to assess the effect PLM has on steady-state inactivation. The interval between each sweep was 80 s to allow channels to recover from previous inactivation. The postpulse/prepulse ratio (I/Imax) is plotted versus inactivating voltage. Single Boltzmann fits were used to determine values for Vhalf and the slope factor. In the presence of PLM, the steady-state inactivation curve is right-shifted 7.7 mV (p < 0.05, n = 4–6), and the slope factor is decreased from 13.5 ± 2.3 to 9.2 ± 2.1 (p < 0.05, n = 4–6).
Figure 6
Figure 6
PLM promotes a deep inactivated state from which recovery is slow. (A) Recovery from a short inactivating pulse. Ba2+ currents were evoked using a three-pulse protocol with 100 ms pre- and postpulses to 0 mV bracketing a 500-ms inactivating pulse to +10 mV. The interval between the inactivation pulse and postpulse (recovery time) was increased to determine the recovery time for inactivation. The interval between sweeps was 30 s. CaV1.2 currents (±)PLM were scaled to peak prepulse current and superimposed for easier comparison. (B) The ratio of Ba2+ currents measured before and after 500 ms inactivating steps (IPost/IPre ratio) is plotted versus recovery time. Smooth lines are single exponential fits: τ = 30.6 ± 5.1 and 27.3 ± 4.3 ms for (−)PLM and (+)PLM respectively (n = 5, not significantly different). (C) Recovery from a long conditioning pulse. Currents generated as described for A except inactivation was generated by a single 20-s step to +10 mV and the pre- and postpulse voltages were −10 mV. Recovery from inactivation was determined by a train of postpulses (shown). The 20-s inactivating pulse is not shown, but its position is indicated by a dashed line after the prepulse in pulse protocol. (D) The IPost/IPre is plotted versus recovery time for 20-s inactivating data. Smooth lines are single exponential fits: τ = 10.1 ± 1.9 s and 12.5 ± 1.8 s for (−)PLM and (+)PLM, respectively (n = 7, not significantly different). Asterisks above data points indicates significant difference the fraction of recovered current between (−) and (+) PLM at each time point.
Figure 7
Figure 7
Dynamic effects of PLM on ionic flux. (AE) Difference Ca2+ currents (10 mM Ca2+ as charge carrier) were calculated from averaged currents (n = 10–12) from cells recorded in the absence and presence of PLM for 25 ms at potentials from −10 to +30 mV. (F) Integrated difference currents (gray shading) versus step voltage were used to quantify voltage-dependent changes in Ca2+ flux induced by PLM.
Figure 8
Figure 8
Cardiac action potential generated CaV1.2 currents are increased by PLM. (A) Ca2+ currents generated by a human cardiac action potential are superimposed from two cells in the absence (gray trace) or presence (black trace) of PLM. The currents were normalized to the plateau phase indicated by the first pair of vertical dashed lines. The second pair of vertical dashed lines corresponds to the repolarization phase of the cAP and marks the area over which the currents were integrated to determine normalized charge (B). (B) Integration of the final 200 ms of cAP-generated currents indicates that the fraction of current is increased during repolarization.

References

    1. Hille B. Sinauer; Sunderland, MA: 2001. Ion Channels of Excitable Membranes.
    1. Splawski I., Timothy K.W., Keating M.T. Ca(V)1.2 calcium channel dysfunction causes a multisystem disorder including arrhythmia and autism. Cell. 2004;119:19–31. - PubMed
    1. Barrett C.F., Tsien R.W. The Timothy syndrome mutation differentially affects voltage- and calcium-dependent inactivation of CaV1.2 L-type calcium channels. Proc. Natl. Acad. Sci. USA. 2008;105:2157–2162. - PMC - PubMed
    1. Yarotskyy V., Gao G., Elmslie K.S. The Timothy syndrome mutation of cardiac CaV1.2 (L-type) channels: multiple altered gating mechanisms and pharmacological restoration of inactivation. J. Physiol. 2009;587:551–565. - PMC - PubMed
    1. Buraei Z., Anghelescu M., Elmslie K.S. Slowed N-type calcium channel (CaV2.2) deactivation by the cyclin-dependent kinase inhibitor roscovitine. Biophys. J. 2005;89:1681–1691. - PMC - PubMed

Publication types

LinkOut - more resources