. 2010 Apr 7;98(7):1160-9.
doi: 10.1016/j.bpj.2009.12.4276.

Stationary gating of GluN1/GluN2B receptors in intact membrane patches

Affiliations

Stationary gating of GluN1/GluN2B receptors in intact membrane patches

Stacy A Amico-Ruvio et al. Biophys J. .

Abstract

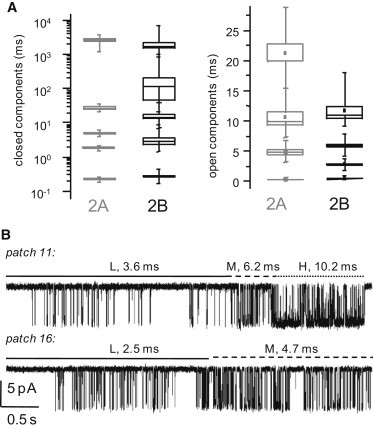
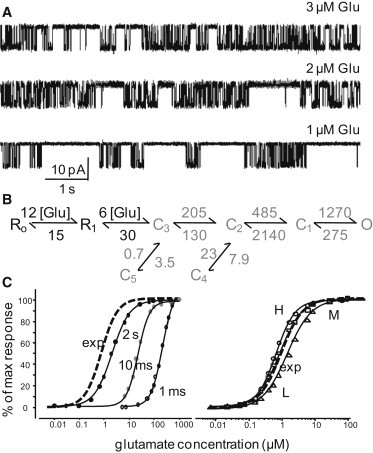
NMDA receptors are heteromeric glutamate-gated channels composed of GluN1 and GluN2 subunits. Receptor isoforms that differ in their GluN2-subunit type (A-D) are expressed differentially throughout the central nervous system and have distinct kinetic properties in recombinant systems. How specific receptor isoforms contribute to the functions generally attributed to NMDA receptors remains unknown, due in part to the incomplete functional characterization of individual receptor types and unclear molecular composition of native receptors. We examined the stationary gating kinetics of individual rat recombinant GluN1/GluN2B receptors in cell-attached patches of transiently transfected HEK293 cells and used kinetic analyses and modeling to describe the full range of this receptor's gating behaviors. We found that, like GluN1/GluN2A receptors, GluN1/GluN2B receptors have three gating modes that are distinguishable by their mean open durations. However, for GluN1/GluN2B receptors, the modes also differed markedly in their mean closed durations and thus generated a broader range of open probabilities. We also found that regardless of gating mode, glutamate dissociation occurred approximately 4-fold more slowly (k(-) = 15 s(-1)) compared to that observed in GluN1/GluN2A receptors. On the basis of these results, we suggest that slow glutamate dissociation and modal gating underlie the long heterogeneous activations of GluN1/GluN2B receptors.


Figures

Figure 1
Figure 1
Activity of individual GluN1/GluN2B channels in cell-attached patches. (A) Top: 50-s portions from two cell-attached records (left, patch 11; right, patch 20), each containing only one active 2B channel, are expanded in the 10 traces below (1 kHz) (middle). Bottom: The underlined segment is shown at higher resolution (12 kHz) below; openings are down. (B) Calculated equilibrium Po, MCT, and MOT durations for entire single-channel records of 2A (n = 12, gray) and 2B (n = 31, black) receptors. (C) Histograms of open and closed interval durations for patch 11 (37,796 events) overlaid with their respective probability distribution functions (thick lines) and individual exponential components (thin lines) calculated from a model with five closed and four open states; insets: time constants (ms) and areas (%) of illustrated exponential components. (D) Time constants for individual open components in all the 2B saturation records considered. Each record had two to four open components: τOfast (○, n = 31); τOL (▴, n = 20); τOM (□, n = 28); τOH (●, n = 13).
Figure 2
Figure 2
GluN1/GluN2B receptors undergo modal gating. (A) Statistical graphs (box, mean ± SE; whiskers, range) for 2A (gray, n = 12) and 2B (black, n = 31) receptors illustrate dissimilar ranges of time constants for closed, but not open, components. (B) Portions of single-channel traces selected from two separate records illustrate that spontaneous changes in the pattern of activity correlate with changes in the MOT: low (L), continuous line; medium (M), interrupted line; and high (H), dotted line.
Figure 3
Figure 3
Kinetic mechanism of GluN1/GluN2B gating. (A) Representative traces of low, medium, and high activity patterns. (B) Histograms of open and closed interval durations for groups of low (patch 9; 36,548 events), medium (patch 26; 64,973 events), and high (patch 4; 64,333 events) periods. Thick lines represent probability density functions calculated from fits by a 5C2O model; thin lines represent individual exponential components; for each distribution, time constants (ms) and areas (%) are indicated. (C) Reaction mechanisms estimated from fits to (top, boxed) data in entire records and (bottom) data selected for each mode. All states represent receptor conformations fully bound with Glu and Gly (C, nonconductive; O, conductive). Rate constants above each arrow are in s−1 and represent means of the values estimated for each record: whole records, n = 31, 4.1 × 10⁶ events; low, n = 17, 3.7 × 10⁵ events; medium, n = 20, 1.8 × 10⁶ events; and high, n = 7, 4.9 × 10⁵ events. (D) Free-energy profiles for the equilibrium gating reaction calculated with the rate constants estimated for each mode and illustrated in panel C. Green, blue, and purple represent consistently results for low, medium, and high, respectively.
Figure 4
Figure 4
Slow dissociation of Glu from GluN1/GluN2B channels. (A) Portions of records obtained with three subsaturating Glu concentrations (indicated above each trace) and saturating Gly (0.1 mM). (B) Reaction mechanism illustrates association and dissociation rate constants (in μM−1s−1 and s−1, black) obtained from fits to entire single-channel records obtained at three Glu concentrations (3, 2, and 1 μM; n = 12); gating rate constants (in s−1, gray) represent the means of values obtained for each record at saturation (n = 31) with the simplified model illustrated. (C) Left: Experimental (whole-cell) dose response to 5-s pulses of 1 mM Glu (dotted line, EC50 = 1.5 μM) is superimposed, for easy comparison, on curves constructed from simulations with the model in panel B to 2-s, 10-ms, and 1-ms pulses of 1 mM Glu. Right: Experimental dose response (dotted line) superimposed on responses to 2-s pulses simulated with gating rates optimized for L- (), M- (), or H-mode () activity.
Figure 5
Figure 5
Macroscopic responses of GluN1/GluN2B channels. (A) Whole-cell currents recorded from two cells; desensitization kinetics (τD) and extent (Iss/Ipk) are indicated for each trace. (B) Experimental traces in panel A (gray) are shown normalized to their peak current and superimposed on a trace simulated with the average model in Fig. 4B (black). (C) Left: Responses to a 5-s pulse simulated with L-, M-, or H-mode illustrate predicted differences in peak amplitudes. Right: The same traces shown at left are normalized to their respective peak response to illustrate predicted differences in the extent and kinetics of macroscopic desensitization.

Similar articles

Cited by

References

    1. Collingridge G.L., Lester R.A. Excitatory amino acid receptors in the vertebrate central nervous system. Pharmacol. Rev. 1989;41:143–210. - PubMed
    1. McBain C.J., Mayer M.L. N-methyl-d-aspartic acid receptor structure and function. Physiol. Rev. 1994;74:723–760. - PubMed
    1. Sprengel R., Single F.N. Mice with genetically modified NMDA and AMPA receptors. Ann. N. Y. Acad. Sci. 1999;868:494–501. - PubMed
    1. Lester R.A., Clements J.D., Jahr C.E. Channel kinetics determine the time course of NMDA receptor-mediated synaptic currents. Nature. 1990;346:565–567. - PubMed
    1. Li J.H., Wang Y.H., Vicini S. Developmental changes in localization of NMDA receptor subunits in primary cultures of cortical neurons. Eur. J. Neurosci. 1998;10:1704–1715. - PubMed

Publication types

LinkOut - more resources