

The mechanical properties of Drosophila jump muscle expressing wild-type and embryonic Myosin isoforms
- PMID: 20371321
- PMCID: PMC2849092
- DOI: 10.1016/j.bpj.2009.11.051
The mechanical properties of Drosophila jump muscle expressing wild-type and embryonic Myosin isoforms
Abstract
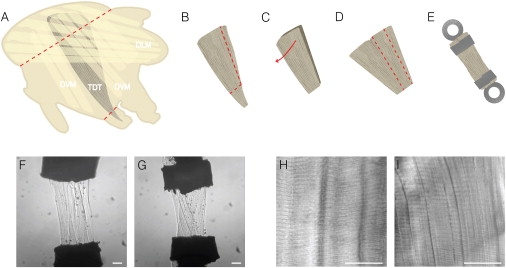
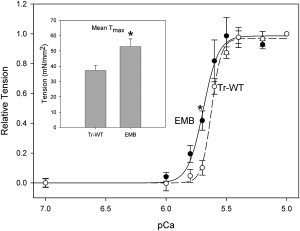
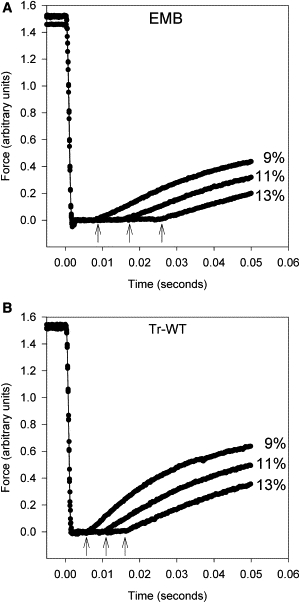
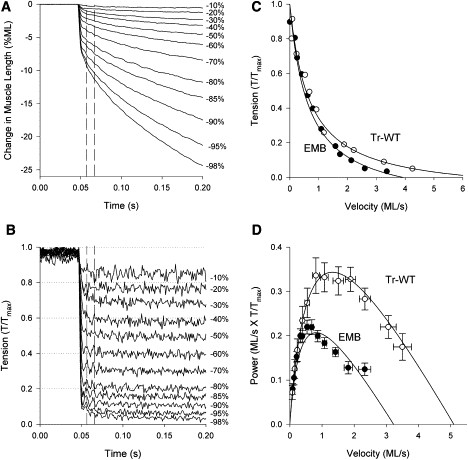
Transgenic Drosophila are highly useful for structure-function studies of muscle proteins. However, our ability to mechanically analyze transgenically expressed mutant proteins in Drosophila muscles has been limited to the skinned indirect flight muscle preparation. We have developed a new muscle preparation using the Drosophila tergal depressor of the trochanter (TDT or jump) muscle that increases our experimental repertoire to include maximum shortening velocity (V(slack)), force-velocity curves and steady-state power generation; experiments not possible using indirect flight muscle fibers. When transgenically expressing its wild-type myosin isoform (Tr-WT) the TDT is equivalent to a very fast vertebrate muscle. TDT has a V(slack) equal to 6.1 +/- 0.3 ML/s at 15 degrees C, a steep tension-pCa curve, isometric tension of 37 +/- 3 mN/mm(2), and maximum power production at 26% of isometric tension. Transgenically expressing an embryonic myosin isoform in the TDT muscle increased isometric tension 1.4-fold, but decreased V(slack) 50% resulting in no significant difference in maximum power production compared to Tr-WT. Drosophila expressing embryonic myosin jumped <50% as far as Tr-WT that, along with comparisons to frog jump muscle studies, suggests fast muscle shortening velocity is relatively more important than high tension generation for Drosophila jumping.
Copyright (c) 2010 Biophysical Society. Published by Elsevier Inc. All rights reserved.
Figures
Similar articles
-
Mechanical analysis of Drosophila indirect flight and jump muscles.Methods. 2012 Jan;56(1):69-77. doi: 10.1016/j.ymeth.2011.10.015. Epub 2011 Nov 7. Methods. 2012. PMID: 22079350 Free PMC article. Review.
-
The load dependence of muscle's force-velocity curve is modulated by alternative myosin converter domains.Am J Physiol Cell Physiol. 2019 Jun 1;316(6):C844-C861. doi: 10.1152/ajpcell.00494.2018. Epub 2019 Mar 13. Am J Physiol Cell Physiol. 2019. PMID: 30865518 Free PMC article.
-
Alternative N-terminal regions of Drosophila myosin heavy chain tune muscle kinetics for optimal power output.Biophys J. 2004 Sep;87(3):1805-14. doi: 10.1529/biophysj.103.032078. Biophys J. 2004. PMID: 15345559 Free PMC article.
-
An alternative domain near the ATP binding pocket of Drosophila myosin affects muscle fiber kinetics.Biophys J. 2006 Apr 1;90(7):2427-35. doi: 10.1529/biophysj.105.075184. Epub 2006 Jan 6. Biophys J. 2006. PMID: 16399836 Free PMC article.
-
Muscle mechanics: adaptations with exercise-training.Exerc Sport Sci Rev. 1996;24:427-73. Exerc Sport Sci Rev. 1996. PMID: 8744258 Review.
Cited by
-
Mechanical analysis of Drosophila indirect flight and jump muscles.Methods. 2012 Jan;56(1):69-77. doi: 10.1016/j.ymeth.2011.10.015. Epub 2011 Nov 7. Methods. 2012. PMID: 22079350 Free PMC article. Review.
-
A Candidate RNAi Screen Reveals Diverse RNA-Binding Protein Phenotypes in Drosophila Flight Muscle.Cells. 2021 Sep 22;10(10):2505. doi: 10.3390/cells10102505. Cells. 2021. PMID: 34685485 Free PMC article.
-
The load dependence of muscle's force-velocity curve is modulated by alternative myosin converter domains.Am J Physiol Cell Physiol. 2019 Jun 1;316(6):C844-C861. doi: 10.1152/ajpcell.00494.2018. Epub 2019 Mar 13. Am J Physiol Cell Physiol. 2019. PMID: 30865518 Free PMC article.
-
An embryonic myosin isoform enables stretch activation and cyclical power in Drosophila jump muscle.Biophys J. 2013 Jun 18;104(12):2662-70. doi: 10.1016/j.bpj.2013.04.057. Biophys J. 2013. PMID: 23790374 Free PMC article.
-
Five Alternative Myosin Converter Domains Influence Muscle Power, Stretch Activation, and Kinetics.Biophys J. 2018 Mar 13;114(5):1142-1152. doi: 10.1016/j.bpj.2017.12.045. Biophys J. 2018. PMID: 29539400 Free PMC article.
References
-
- Lowey S., Waller G.S., Trybus K.M. Function of skeletal muscle myosin heavy and light chain isoforms by an in vitro motility assay. J. Biol. Chem. 1993;268:20414–20418. - PubMed
-
- Harridge S.D. Plasticity of human skeletal muscle: gene expression to in vivo function. Exp. Physiol. 2007;92:783–797. - PubMed
-
- Larsson L., Li X., Frontera W.R. Effects of aging on shortening velocity and myosin isoform composition in single human skeletal muscle cells. Am. J. Physiol. 1997;272:C638–C649. - PubMed
-
- Baldwin K.M., Haddad F. Effects of different activity and inactivity paradigms on myosin heavy chain gene expression in striated muscle. J. Appl. Physiol. 2001;90:345–357. - PubMed
-
- Swank D.M., Wells L., Bernstein S.I. Determining structure/function relationships for Sarcomeric myosin heavy chain by genetic and transgenic manipulation of Drosophila. Microsc. Res. Tech. 2000;50:430–442. - PubMed
Publication types
MeSH terms
Substances
Grants and funding
LinkOut - more resources
Full Text Sources
Molecular Biology Databases
