. 2010 Apr 7;98(7):1227-36.
doi: 10.1016/j.bpj.2009.11.050.

Chemo-mechanical coupling in F(1)-ATPase revealed by catalytic site occupancy during catalysis

Affiliations

Chemo-mechanical coupling in F(1)-ATPase revealed by catalytic site occupancy during catalysis

Rieko Shimo-Kon et al. Biophys J. .

Abstract

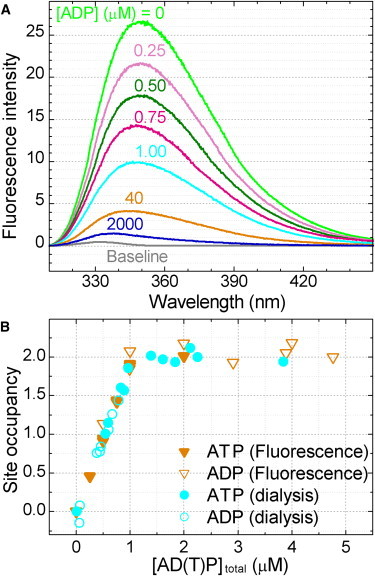
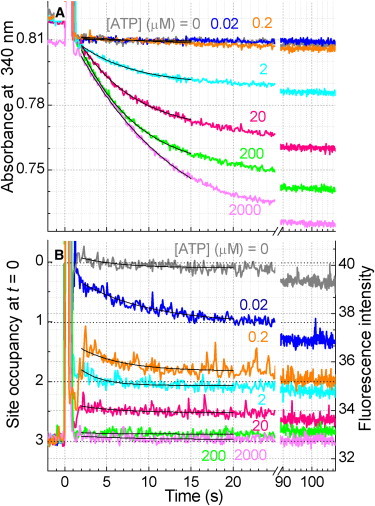
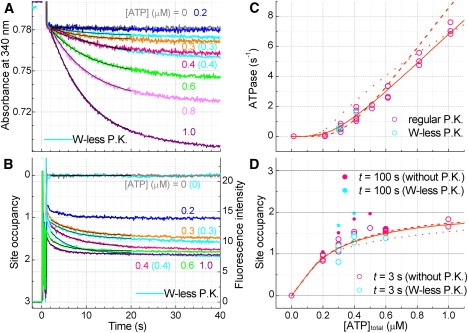
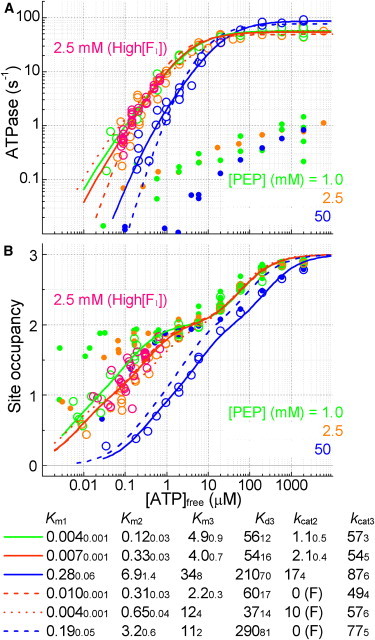
F(1)-ATPase is a rotary molecular motor in which the central gamma subunit rotates inside a cylinder made of alpha(3)beta(3) subunits. To clarify how ATP hydrolysis in three catalytic sites cooperate to drive rotation, we measured the site occupancy, the number of catalytic sites occupied by a nucleotide, while assessing the hydrolysis activity under identical conditions. The results show hitherto unsettled timings of ADP and phosphate releases: starting with ATP binding to a catalytic site at an ATP-waiting gamma angle defined as 0 degrees , phosphate is released at approximately 200 degrees , and ADP is released during quick rotation between 240 degrees and 320 degrees that is initiated by binding of a third ATP. The site occupancy remains two except for a brief moment after the ATP binding, but the third vacant site can bind a medium nucleotide weakly.


Figures

Figure 1
Figure 1
Experimental scheme for coupling between catalysis and rotation in F1-ATPase. Circles at bottom represent three catalytic sites (β subunits), with the central arrow showing γ orientation (the orientation in the first ATP-waiting dwell is defined as 0° and the arrow is arbitrarily chosen upward for this orientation). (A and B) Two possible schemes that differ in the release timing of Pi formed by hydrolysis (17). This study points to A, with asterisks indicating the low affinity open site that is in rapid equilibrium with medium nucleotide; at high [ATP], an ATP molecule that happens to be in this site at the Pi release stage may engage in the next rotation. Colors in the time course at top indicate the site in which the rate-limiting reaction is to occur in A: ATP binding at 0°, and hydrolysis and Pi release at 80°.
Figure 2
Figure 2
Relation between quenching of tryptophan fluorescence and catalytic site occupancy. (A) Quenching of the fluorescence of reporter tryptophan. Fluorescence spectra of 470 nM ΔNCβY341W measured 100 s after the addition of ADP. The spectrum of the medium alone (baseline), mainly the water Raman emission, has been subtracted from each spectrum. (B) Catalytic site occupancy estimated from fluorescence quenching and micro equilibrium dialysis. To 470 nM ΔNCβY341W (fresh for each measurement) in buffer M, MgATP, or MgADP was added. Horizontal axis is the total nucleotide concentration in the cuvette (fluorescence) or in the central chamber containing F1 (dialysis). For fluorescence, the occupancy was assumed to be proportional to the degree of quenching, full quenching to the buffer level taken as occupancy of three.
Figure 3
Figure 3
Time courses of (A) ATP hydrolysis activity and (B) nucleotide binding at various [ATP]s. 19 nM F1 was added at time 0 to buffer M containing an ATP regeneration system (1.0 mM PEP, 0.5 mg mL−1 W-less PK, 0.15 mM NADH, 0.05 mg mL−1 LDH). NADH and LDH were omitted in B. The slight decrease at 0 μM ATP in B is due to photobleaching of tryptophan. The baseline fluorescence of ∼32.8 in B comes mostly from the W-less PK. Smooth black curves show fits from which 3-s values were calculated; the values are included in Fig. 4, B and C.
Figure 4
Figure 4
ATPase activity and site occupancy at different [ATP]s. Solid symbols show individual data and open symbols, where shown, their average. Where data points overlap, they are slightly displaced for clarity. [F1] = 19 nM. (A) ATPase activity measured as in Fig. 3A with 1.0 mM PEP and 0.5 or 0.7 mg mL−1 W-less PK (cyan) or 0.7 mg mL−1 regular PK (orange and blue). Orange and cyan, the initial activity at 3 s after the beginning of F1 mixing; blue, the activity at 100–300 s. [ATP]free was calculated from the binding parameters in B. Orange line, Michaelis-Menten fit with Vmax = 59 s−1 and Km = 6.8 μM, which is reproduced on a linear scale in BE as a reference. (B) Catalytic site occupancy estimated from fluorescence quenching under conditions identical to cyan symbols in A except that NADH and LDH were omitted. Pink and green plots show occupancy at t = 3 s and 100 s, respectively. [ATP]free was calculated from the measured occupancy. Lines show fits with [S]/([S] + Kd1) + [S]/([S] + Kd2) + [S]/([S] + Kd3) where S represents free ATP (Eq. S1), with parameter values at bottom right (SE in smaller fonts). These lines are reproduced as broken lines in CE. (C) Catalytic site occupancy in the absence of the ATP regenerating system. Symbols and lines as in B. The differences between B and C are due to the presence of 1 mM PEP in B (also see time courses in Fig. S1). (D and E) Occupancy with (D) ADP and (E) AMP-PNP in buffer M in the absence of an ATP regenerating system. Horizontal axes show [ADP] or [AMP-PNP].
Figure 5
Figure 5
ATPase activity and ATP binding at low ATP/F1 ratios. 190 nM F1 was added to an ATP regenerating system consisting of 2.5 mM PEP, 0.5 or 0.75 mg mL−1 W-less (cyan plots in AD) or 0.5 mg mL−1 regular PK (other colors), 0.075 mM NADH and 0.025 mg mL−1 LDH. (A) Time courses of ATP hydrolysis. (B) Time courses of ATP binding in the presence of W-less PK and 2.5 mM PEP (cyan) or 2.5 mM PEP alone (other colors). NADH and LDH were omitted. The right-hand scale does not apply to the W-less data, for which the intensity at full quenching was ∼2. (C) ATP dependence of the initial hydrolysis activity. [ATP]total here has been corrected for contaminant nucleotides in NADH (<30 nM). (D) Catalytic site occupancy at 3 s (open symbols) or 100 s (solid). Cyan plots, with W-less PK; pink, without PK. Black curves in A and B are fit from which 3-s values were obtained. Solid, dashed, and dotted lines in C and D are fit with kcat2 = 2.1 s−1 (best fit), 0 (fixed), and 10 s−1 (fixed), respectively (see Fig. 6).
Figure 6
Figure 6
Effect of PEP on ATPase activity and catalytic site occupancy. (A) ATPase activity at indicated [PEP]. Data for 1.0 mM PEP are reproduction of Fig. 4A, and data for 2.5 mM PEP at high [F1] are from Fig. 5C. Other data are for 9–93 nM F1 in buffer M containing 0.5–0.75 mg mL−1 regular PK, 0.15 mM NADH, and 0.05 mg mL−1 LDH. Open symbols, the initial rate at 3 s; solid symbols, the rate at 100–300 s. (B) Catalytic site occupancy with indicated [PEP] without an ATP regenerating system. Data for 2.5 mM PEP at high [F1] are from Fig. 5D. [F1] = 19 nM in others. Open symbols, at 3 s; solid symbols, at 100 s. Data for 1.0 mM PEP here, obtained without PK, do not significantly differ from those in Fig. 4B with PK. Lines are global fit to the ATPase activity and occupancy with Eqs. 3 and 4. Parameter values are shown at bottom (SE in smaller fonts); Km and Kd3 in μM, kcat in s−1, and (F) indicates a fixed value.
Figure 7
Figure 7
Time courses of hydrolysis and ADP release after ATP depletion. (A) Hydrolysis at 1.0 mM PEP. At time 0, 190 nM ΔNCβY341W was added to 1.0 mM PEP, 0.5 mg mL−1 W-less PK, 0.075 mM NADH, 0.05 mg mL−1 LDH, and indicated ATP in buffer M. At arrows, 2 μM ΔNC (0.022 volume of 91 μM ΔNC) was added to deplete ATP. The slight decline of absorbance after 6 s was due mostly to the hydrolysis by ΔNC, as confirmed by addition of ΔNC alone (not shown). (B) Occupancy at 1.0 mM PEP. Experiments as in A except NADH and LDH were omitted. Gray bars show the fluorescence intensity of added ΔNC measured separately, which accounts for the immediate rise in fluorescence. The slow increases in green and cyan curves between 5–35 s indicate ADP release with a rate <0.01 s−1. At the gray arrow, ΔNC was added again in both green and cyan curves. Brown is a control without ATP, showing the fluorescence level at zero occupancy.

References

    1. Boyer P.D., Kohlbrenner W.E. The present status of the binding-change mechanism and its relation to ATP formation by chloroplasts. In: Selman B.R., Selman-Reimer S., editors. Energy Coupling in Photosynthesis. Elsevier; Amsterdam: 1981. pp. 231–240.
    1. Oosawa F., Hayashi S. The loose coupling mechanism in molecular machines of living cells. Adv. Biophys. 1986;22:151–183. - PubMed
    1. Noji H., Yasuda R., Kinosita K., Jr. Direct observation of the rotation of F1-ATPase. Nature. 1997;386:299–302. - PubMed
    1. Abrahams J.P., Leslie A.G.W., Walker J.E. Structure at 2.8 Å resolution of F1-ATPase from bovine heart mitochondria. Nature. 1994;370:621–628. - PubMed
    1. Yasuda R., Noji H., Yoshida M. F1-ATPase is a highly efficient molecular motor that rotates with discrete 120° steps. Cell. 1998;93:1117–1124. - PubMed

Publication types

LinkOut - more resources