

Energetics at the DNA supercoiling transition
- PMID: 20371326
- PMCID: PMC2849096
- DOI: 10.1016/j.bpj.2009.12.4292
Energetics at the DNA supercoiling transition
Abstract
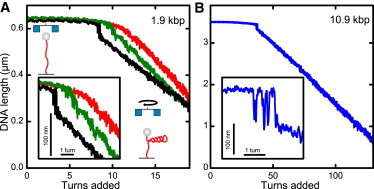
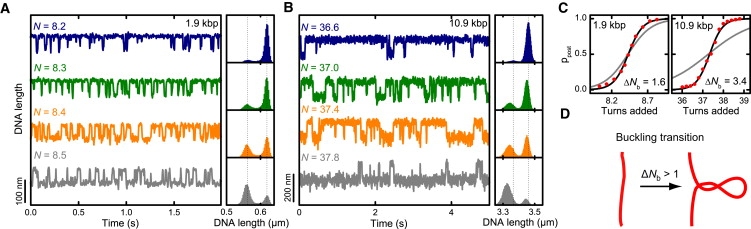
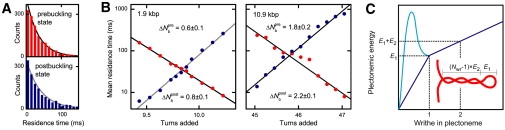
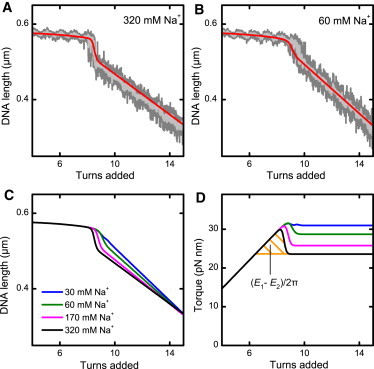
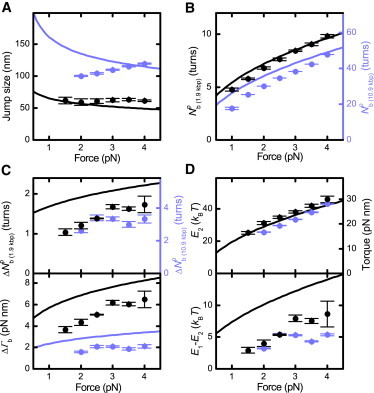
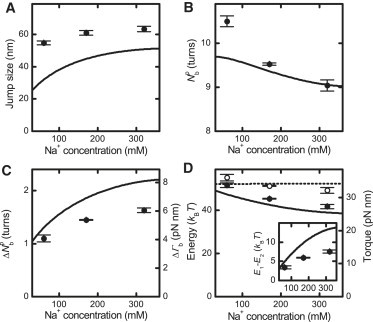
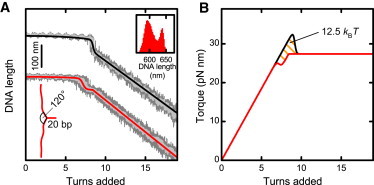
Twisting a DNA molecule held under constant tension is accompanied by a transition from a linear to a plectonemic DNA configuration, in which part of the applied twist is absorbed in a superhelical structure. Recent experiments revealed the occurrence of an abrupt extension change at the onset of this transition. To elucidate its origin we study this abrupt DNA shortening using magnetic tweezers. We find that it strongly depends on the length of the DNA molecule and the ionic strength of the solution. This behavior can be well understood in the framework of a model in which the energy per writhe for the initial plectonemic loop is larger than for subsequent turns of the superhelix. By quantitative data analysis, relevant plectoneme energies and other parameters were extracted, providing good agreement with a simple theory. As a direct confirmation of the initial-loop model, we find that for a kinked DNA molecule the abrupt extension change occurs at significantly lower twist than the subsequent superhelix formation. This should allow pinning of the plectoneme position within supercoiled DNA if a kinked substrate is used, and enable the detection of enzymes and proteins which, themselves, bend or kink DNA.
Copyright (c) 2010 Biophysical Society. Published by Elsevier Inc. All rights reserved.
Figures
Similar articles
-
Abrupt buckling transition observed during the plectoneme formation of individual DNA molecules.Phys Rev Lett. 2008 Apr 11;100(14):148301. doi: 10.1103/PhysRevLett.100.148301. Epub 2008 Apr 8. Phys Rev Lett. 2008. PMID: 18518075 Free PMC article.
-
Discontinuities at the DNA supercoiling transition.Phys Rev E Stat Nonlin Soft Matter Phys. 2009 Oct;80(4 Pt 1):040901. doi: 10.1103/PhysRevE.80.040901. Epub 2009 Oct 15. Phys Rev E Stat Nonlin Soft Matter Phys. 2009. PMID: 19905264 Free PMC article.
-
Torque and dynamics of linking number relaxation in stretched supercoiled DNA.Phys Rev E Stat Nonlin Soft Matter Phys. 2007 Aug;76(2 Pt 1):021926. doi: 10.1103/PhysRevE.76.021926. Epub 2007 Aug 29. Phys Rev E Stat Nonlin Soft Matter Phys. 2007. PMID: 17930084
-
Conformational and thermodynamic properties of supercoiled DNA.Annu Rev Biophys Biomol Struct. 1994;23:609-43. doi: 10.1146/annurev.bb.23.060194.003141. Annu Rev Biophys Biomol Struct. 1994. PMID: 7919794 Review.
-
Tracking topoisomerase activity at the single-molecule level.Annu Rev Biophys Biomol Struct. 2005;34:201-19. doi: 10.1146/annurev.biophys.34.040204.144433. Annu Rev Biophys Biomol Struct. 2005. PMID: 15869388 Review.
Cited by
-
Torque measurements reveal sequence-specific cooperative transitions in supercoiled DNA.Proc Natl Acad Sci U S A. 2012 Apr 17;109(16):6106-11. doi: 10.1073/pnas.1113532109. Epub 2012 Apr 2. Proc Natl Acad Sci U S A. 2012. PMID: 22474350 Free PMC article.
-
A Primer on the oxDNA Model of DNA: When to Use it, How to Simulate it and How to Interpret the Results.Front Mol Biosci. 2021 Jun 17;8:693710. doi: 10.3389/fmolb.2021.693710. eCollection 2021. Front Mol Biosci. 2021. PMID: 34235181 Free PMC article. Review.
-
Probing the salt dependence of the torsional stiffness of DNA by multiplexed magnetic torque tweezers.Nucleic Acids Res. 2017 Jun 2;45(10):5920-5929. doi: 10.1093/nar/gkx280. Nucleic Acids Res. 2017. PMID: 28460037 Free PMC article.
-
Fork sensing and strand switching control antagonistic activities of RecQ helicases.Nat Commun. 2013;4:2024. doi: 10.1038/ncomms3024. Nat Commun. 2013. PMID: 23771268 Free PMC article.
-
Camera-based three-dimensional real-time particle tracking at kHz rates and Ångström accuracy.Nat Commun. 2015 Jan 7;6:5885. doi: 10.1038/ncomms6885. Nat Commun. 2015. PMID: 25565216 Free PMC article.
References
-
- Harada Y., Ohara O., Kinosita K., Jr. Direct observation of DNA rotation during transcription by Escherichia coli RNA polymerase. Nature. 2001;409:113–115. - PubMed
-
- Seidel R., Dekker C. Single-molecule studies of nucleic acid motors. Curr. Opin. Struct. Biol. 2007;17:80–86. - PubMed
-
- Koster D.A., Palle K., Dekker N.H. Antitumor drugs impede DNA uncoiling by topoisomerase I. Nature. 2007;448:213–217. - PubMed
-
- Kouzine F., Sanford S., Levens D. The functional response of upstream DNA to dynamic supercoiling in vivo. Nat. Struct. Mol. Biol. 2008;15:146–154. - PubMed
-
- Strick T.R., Allemand J.F., Croquette V. The elasticity of a single supercoiled DNA molecule. Science. 1996;271:1835–1837. - PubMed
Publication types
MeSH terms
Substances
LinkOut - more resources
Full Text Sources
Research Materials
