

The photochemical reaction cycle and photoinduced proton transfer of sensory rhodopsin II (Phoborhodopsin) from Halobacterium salinarum
- PMID: 20371336
- PMCID: PMC2849095
- DOI: 10.1016/j.bpj.2009.12.4288
The photochemical reaction cycle and photoinduced proton transfer of sensory rhodopsin II (Phoborhodopsin) from Halobacterium salinarum
Abstract
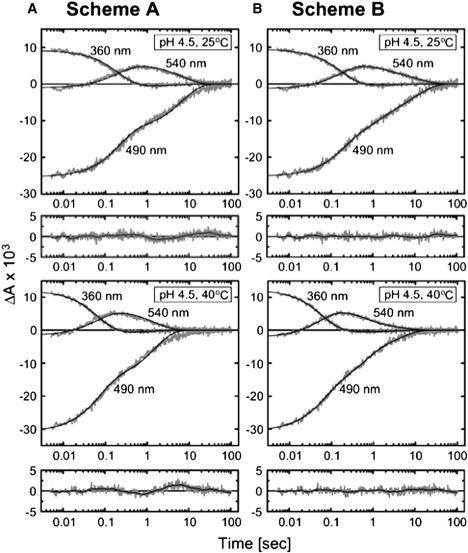
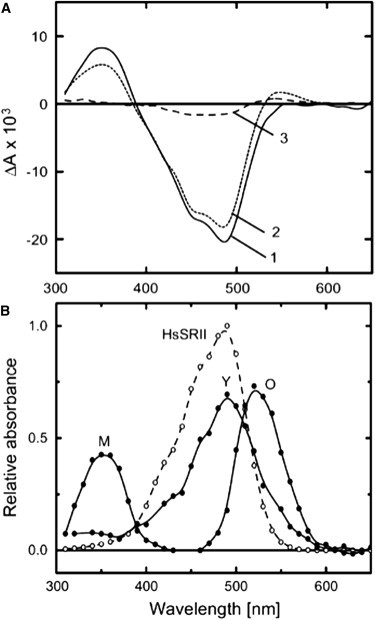
Sensory rhodopsin II (HsSRII, also called phoborhodopsin) is a negative phototaxis receptor of Halobacterium salinarum, a bacterium that avoids blue-green light. In this study, we expressed the protein in Escherichia coli cells, and reconstituted the purified protein with phosphatidylcholine. The reconstituted HsSRII was stable. We examined the photocycle by flash-photolysis spectroscopy in the time range of milliseconds to seconds, and measured proton uptake/release using a transparent indium-tin oxide electrode. The pKa of the counterion of the Schiff base, Asp(73), was 3.0. Below pH 3, the depleted band was observed on flash illumination, but the positive band in the difference spectra was not found. Above pH 3, the basic photocycle was HsSRII (490) --> M (350) --> O (520) --> Y (490) --> HsSRII, where the numbers in parentheses are the maximum wavelengths. The decay rate of O-intermediate and Y-intermediate were pH-independent, whereas the M-intermediate decay was pH-dependent. For 3 < pH < 4.5, the M-decay was one phase, and the rate decreased with an increase in pH. For 4.5 < pH < 6.5, the decay was one phase with pH-independent rates, and azide markedly accelerated the M-decay. These findings suggest the existence of a protonated amino acid residue (X-H) that may serve as a proton relay to reprotonate the Schiff base. Above pH 6.5, the M-decay showed two phases. The fast M-decay was pH-independent and originated from the molecule having a protonated X-H, and the slow M-decay originated from the molecule having a deprotonated X, in which the proton came directly from the outside. The analysis yielded a value of 7.5 for the pKa of X-H. The proton uptake and release occurred during M-decay and O-decay, respectively.
Copyright (c) 2010 Biophysical Society. Published by Elsevier Inc. All rights reserved.
Figures


Similar articles
-
Photocycle of Sensory Rhodopsin II from Halobacterium salinarum (HsSRII): Mutation of D103 Accelerates M Decay and Changes the Decay Pathway of a 13-cis O-like Species.Photochem Photobiol. 2018 Jul;94(4):705-714. doi: 10.1111/php.12917. Epub 2018 Apr 23. Photochem Photobiol. 2018. PMID: 29512821
-
Positioning proton-donating residues to the Schiff-base accelerates the M-decay of pharaonis phoborhodopsin expressed in Escherichia coli.Biophys Chem. 1999 Jun 28;79(3):187-92. doi: 10.1016/s0301-4622(99)00054-x. Biophys Chem. 1999. PMID: 10443011
-
Photoreaction cycle of phoborhodopsin (sensory rhodopsin II) from Halobacterium salinarum expressed in Escherichia coli.Photochem Photobiol. 2010 May-Jun;86(3):571-9. doi: 10.1111/j.1751-1097.2009.00687.x. Epub 2010 Jan 22. Photochem Photobiol. 2010. PMID: 20113429
-
Photochemistry and photoinduced proton-transfer by pharaonis phoborhodopsin.Biochemistry (Mosc). 2001 Nov;66(11):1277-82. doi: 10.1023/a:1013187403599. Biochemistry (Mosc). 2001. PMID: 11743872 Review.
-
Mechanism divergence in microbial rhodopsins.Biochim Biophys Acta. 2014 May;1837(5):546-52. doi: 10.1016/j.bbabio.2013.06.006. Epub 2013 Jul 3. Biochim Biophys Acta. 2014. PMID: 23831552 Free PMC article. Review.
References
-
- Haupts U., Tittor J., Oesterhelt D. Closing in on bacteriorhodopsin: progress in understanding the molecule. Annu. Rev. Biophys. Biomol. Struct. 1999;28:367–399. - PubMed
-
- Lanyi J.K. Proton transfers in the bacteriorhodopsin photocycle. Biochim. Biophys. Acta. 2006;1757:1012–1018. - PubMed
-
- Váró G. Analogies between halorhodopsin and bacteriorhodopsin. Biochim. Biophys. Acta. 2000;1460:220–229. - PubMed
-
- Mukohata Y., Ihara K., Sugiyama Y. Halobacterial rhodopsins. J. Biochem. 1999;125:649–657. - PubMed
MeSH terms
Substances
LinkOut - more resources
Full Text Sources
