

Quantitative analysis of single particle trajectories: mean maximal excursion method
- PMID: 20371337
- PMCID: PMC2849086
- DOI: 10.1016/j.bpj.2009.12.4282
Quantitative analysis of single particle trajectories: mean maximal excursion method
Abstract
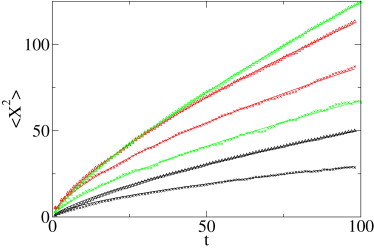
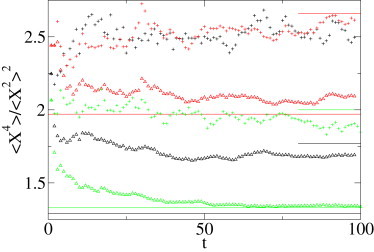
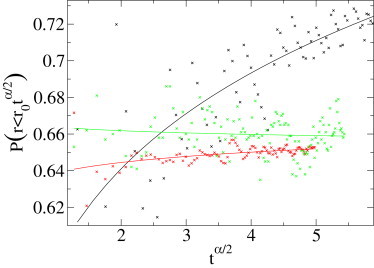
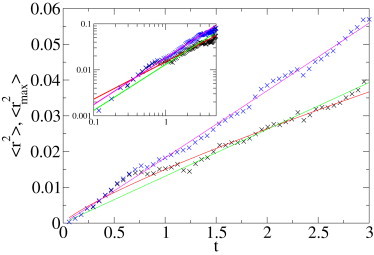
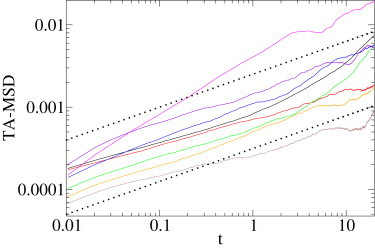
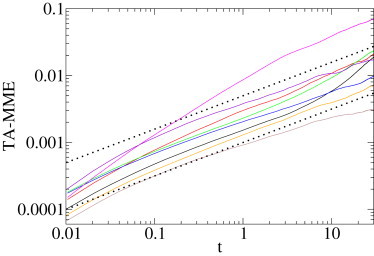
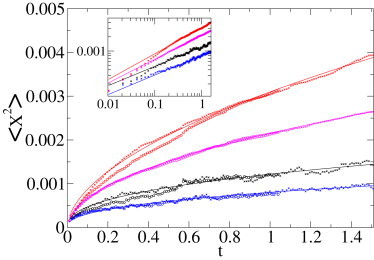
An increasing number of experimental studies employ single particle tracking to probe the physical environment in complex systems. We here propose and discuss what we believe are new methods to analyze the time series of the particle traces, in particular, for subdiffusion phenomena. We discuss the statistical properties of mean maximal excursions (MMEs), i.e., the maximal distance covered by a test particle up to time t. Compared to traditional methods focusing on the mean-squared displacement we show that the MME analysis performs better in the determination of the anomalous diffusion exponent. We also demonstrate that combination of regular moments with moments of the MME method provides additional criteria to determine the exact physical nature of the underlying stochastic subdiffusion processes. We put the methods to test using experimental data as well as simulated time series from different models for normal and anomalous dynamics such as diffusion on fractals, continuous time random walks, and fractional Brownian motion.
Copyright (c) 2010 Biophysical Society. Published by Elsevier Inc. All rights reserved.
Figures
Similar articles
-
Meaningful interpretation of subdiffusive measurements in living cells (crowded environment) by fluorescence fluctuation microscopy.Curr Pharm Biotechnol. 2010 Aug;11(5):527-43. doi: 10.2174/138920110791591454. Curr Pharm Biotechnol. 2010. PMID: 20553227 Free PMC article.
-
Mechanisms underlying anomalous diffusion in the plasma membrane.Curr Top Membr. 2015;75:167-207. doi: 10.1016/bs.ctm.2015.03.002. Epub 2015 Apr 15. Curr Top Membr. 2015. PMID: 26015283 Review.
-
Geometry controlled anomalous diffusion in random fractal geometries: looking beyond the infinite cluster.Phys Chem Chem Phys. 2015 Nov 28;17(44):30134-47. doi: 10.1039/c5cp03548a. Epub 2015 Oct 27. Phys Chem Chem Phys. 2015. PMID: 26503611
-
First-passage-time processes and subordinated Schramm-Loewner evolution.Phys Rev E Stat Nonlin Soft Matter Phys. 2011 Jul;84(1 Pt 1):011134. doi: 10.1103/PhysRevE.84.011134. Epub 2011 Jul 25. Phys Rev E Stat Nonlin Soft Matter Phys. 2011. PMID: 21867140
-
Brownian motion and diffusion: from stochastic processes to chaos and beyond.Chaos. 2005 Jun;15(2):26102. doi: 10.1063/1.1832773. Chaos. 2005. PMID: 16035904 Review.
Cited by
-
Bayesian approach to MSD-based analysis of particle motion in live cells.Biophys J. 2012 Aug 8;103(3):616-626. doi: 10.1016/j.bpj.2012.06.029. Biophys J. 2012. PMID: 22947879 Free PMC article.
-
Resolving mixed mechanisms of protein subdiffusion at the T cell plasma membrane.Nat Commun. 2017 Jun 20;8:15851. doi: 10.1038/ncomms15851. Nat Commun. 2017. PMID: 28631757 Free PMC article.
-
Python algorithms in particle tracking microrheology.Chem Cent J. 2012 Nov 27;6(1):144. doi: 10.1186/1752-153X-6-144. Chem Cent J. 2012. PMID: 23186362 Free PMC article.
-
Computational study on the impact of linkage sequence on the structure and dynamics of lignin.Eur Biophys J. 2024 Nov;53(7-8):405-414. doi: 10.1007/s00249-024-01720-0. Epub 2024 Sep 19. Eur Biophys J. 2024. PMID: 39297929
-
Fluorescence microscopy imaging of a neurotransmitter receptor and its cell membrane lipid milieu.Front Mol Biosci. 2022 Nov 28;9:1014659. doi: 10.3389/fmolb.2022.1014659. eCollection 2022. Front Mol Biosci. 2022. PMID: 36518846 Free PMC article. Review.
References
-
- Titus Lucretius Carus. 2009. On the Nature of Things. Forgotten Books, www.forgottenbooks.org.
-
- Ingenhousz J. T. Barrois le jeune; Paris: 1785. New Experiments and Observations on Diverse Physical Objects.
-
- Brown R. A brief account of microscopical observations made in the months of June, July and August, 1827, on the particles contained in the pollen of plants; and on the general existence of active molecules in organic and inorganic bodies. Philos. Mag. 1828;4:161–173.
-
- Perrin J.B. Brownian motion and molecular reality. Ann. Chim. Phys. 1909;18:5–114.
-
- Nordlund I. A new determination of Avogadro's number from Brownian motion of small mercury spherules. Z. Phys. Chem. 1914;87:40–62.
Publication types
MeSH terms
Substances
LinkOut - more resources
Full Text Sources
Molecular Biology Databases
Miscellaneous
