

Glucocorticoid-regulated genes in eosinophilic esophagitis: a role for FKBP51
- PMID: 20371398
- PMCID: PMC2865682
- DOI: 10.1016/j.jaci.2010.01.038
Glucocorticoid-regulated genes in eosinophilic esophagitis: a role for FKBP51
Abstract
Background: Eosinophilic esophagitis (EE) involves marked accumulation of eosinophils in the esophageal mucosa that responds to swallowed fluticasone propionate (FP) in a subset of patients.
Objectives: We aimed to uncover the mechanism of action of swallowed FP in patients with EE by providing evidence for a topical effect in the esophagus by identifying a molecular signature for FP exposure in vivo.
Methods: Global microarray expression profiles, immunofluorescence microscopy, and cell signaling in esophageal tissue and cell lines were analyzed.
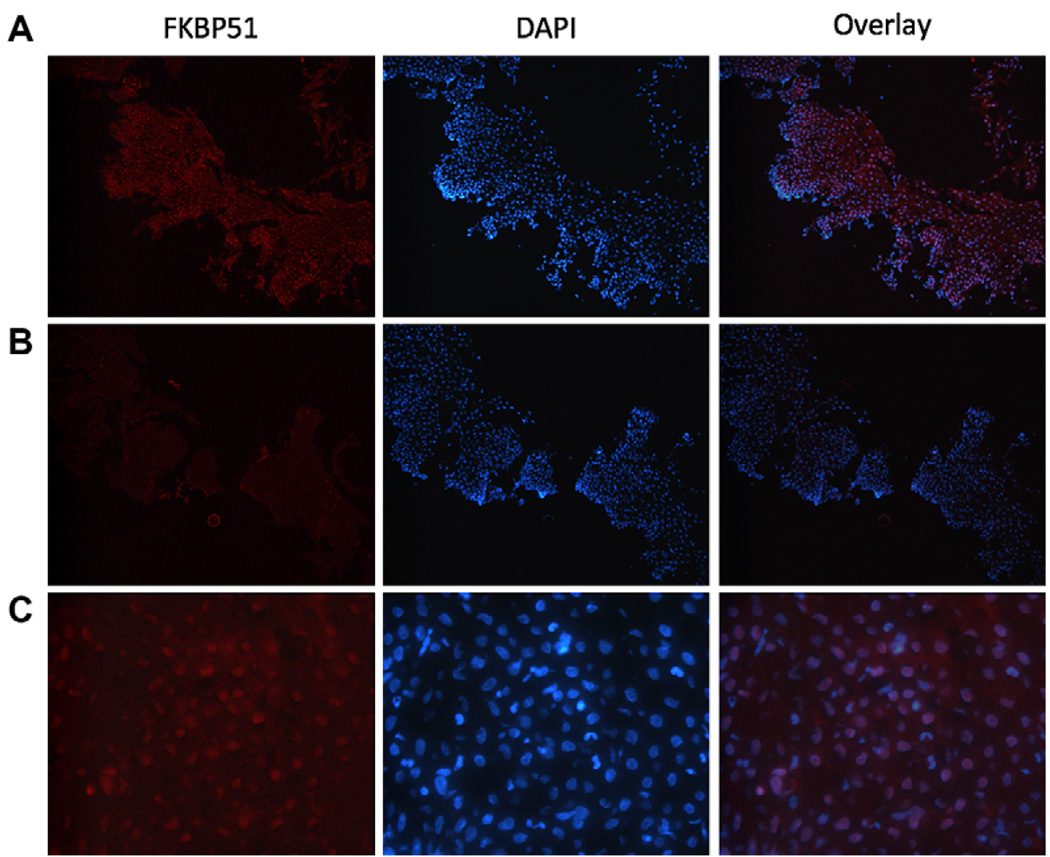
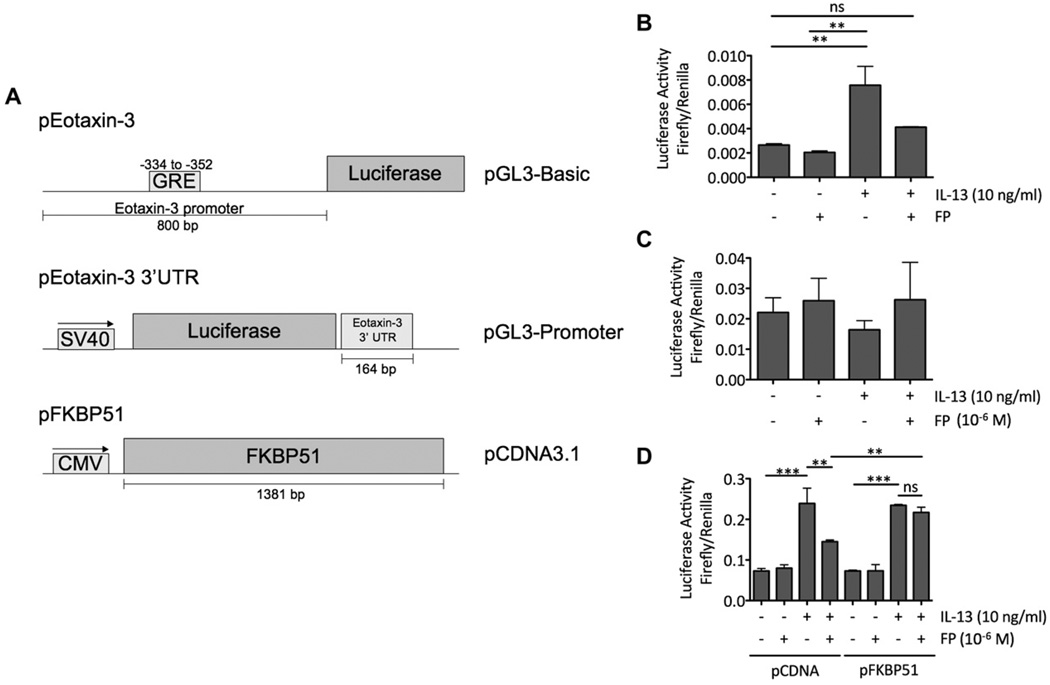
Results: Thirty-two transcripts exhibited altered expression in patients who responded to swallowed FP treatment. Esophageal FK506-binding protein 5 (FKBP51) mRNA levels were increased (P < .05) in FP responders compared with those seen in control subjects and patients with untreated active EE. After FP treatment of esophageal epithelial cells, FKBP51 mRNA and protein levels were increased in a dose- and time-dependent manner by FP treatment in vitro. FP-induced FKBP51 was steroid receptor dependent because RU486 completely inhibited gene and protein induction. The half-life of FKBP51 mRNA was 16 to 18 hours independent of FP treatment. FKBP51 overexpression reduced FP action as assessed by FP inhibition of IL-13-induced eotaxin-3 promoter activity.
Conclusions: Our results suggest that swallowed glucocorticoid treatment directly affects esophageal gene expression in patients with EE. In particular, increased FKBP51 transcript levels identify glucocorticoid exposure in vivo and distinguish FP responders from untreated patients with active EE and patients without EE. In addition, FKBP51 reduces glucocorticoid-mediated inhibition of IL-13 signaling in epithelial cells in vitro, suggesting that FKBP51 might influence FP responsiveness. We propose that esophageal FKBP51 levels have diagnostic and prognostic significance in patients with EE.
Copyright (c) 2010 American Academy of Allergy, Asthma & Immunology. Published by Mosby, Inc. All rights reserved.
Conflict of interest statement
Disclosure of potential conflict of interest: J. M. Caldwell has received a postdoctoral grant from the American Heart Association. C. Blanchard has received research support from the National Institutes of Health, the Digestive Health Center CCHMC, and the American Partnership for Eosinophilic Disorders. M. H. Collins was a subcontractor as a clinical study central review pathologist for GlaxoSmithKline and Ception Therapeutics; was a consultant as a clinical study central review pathologist for Meritage Pharma; and is a Member of the Medical Advisory Panel for the American Partnership for Eosinophilic Diseases. S. S. Aceves has intellectual property patent royalties in Meritage Pharma and is on the Medical Advisory Board for the American Partnership for Eosinophilic Disorders. M. E. Rothenberg is a speaker and consultant for Merck; is a consultant for Centocor, Ception Therapeutics, Nycomed, and Array Biopharmra; has received research support from the National Institutes of Health, the Food Allergy and Anaphylaxis Network, and the Dana Foundation; is on the Medical Advisory Board for the American Partnership for Eosinophilic Disorders; and is on the Executive Council for the International Eosinophil Society. The rest of the authors have declared that they have no conflict of interest.
Figures


Similar articles
-
A randomized, double-blind, placebo-controlled trial of fluticasone propionate for pediatric eosinophilic esophagitis.Gastroenterology. 2006 Nov;131(5):1381-91. doi: 10.1053/j.gastro.2006.08.033. Epub 2006 Aug 16. Gastroenterology. 2006. PMID: 17101314 Clinical Trial.
-
Treatment with topical steroids downregulates IL-5, eotaxin-1/CCL11, and eotaxin-3/CCL26 gene expression in eosinophilic esophagitis.Am J Gastroenterol. 2008 Sep;103(9):2184-93. doi: 10.1111/j.1572-0241.2008.01937.x. Am J Gastroenterol. 2008. PMID: 18844613
-
IL-13 involvement in eosinophilic esophagitis: transcriptome analysis and reversibility with glucocorticoids.J Allergy Clin Immunol. 2007 Dec;120(6):1292-300. doi: 10.1016/j.jaci.2007.10.024. J Allergy Clin Immunol. 2007. PMID: 18073124
-
Overlap of reflux and eosinophilic esophagitis in two patients requiring different therapies: a review of the literature.World J Gastroenterol. 2008 Mar 7;14(9):1463-6. doi: 10.3748/wjg.14.1463. World J Gastroenterol. 2008. PMID: 18322968 Free PMC article. Review.
-
[Effectiveness and safety of fluticasone propionate in therapy of children suffering from asthma. Part I. Mechanisms of actions and clinical effectiveness of treatment in children with asthma].Pol Merkur Lekarski. 2004;17 Suppl 2:5-10. Pol Merkur Lekarski. 2004. PMID: 15688663 Review. Polish.
Cited by
-
Efficacy, dose reduction, and resistance to high-dose fluticasone in patients with eosinophilic esophagitis.Gastroenterology. 2014 Aug;147(2):324-33.e5. doi: 10.1053/j.gastro.2014.04.019. Epub 2014 Apr 22. Gastroenterology. 2014. PMID: 24768678 Free PMC article. Clinical Trial.
-
IL-13 receptor α1 differentially regulates aeroallergen-induced lung responses.J Immunol. 2011 Nov 1;187(9):4873-80. doi: 10.4049/jimmunol.1004159. Epub 2011 Sep 28. J Immunol. 2011. PMID: 21957151 Free PMC article.
-
Steroids in pediatric eosinophilic esophagitis.Gastroenterol Clin North Am. 2014 Jun;43(2):345-56. doi: 10.1016/j.gtc.2014.02.008. Epub 2014 Mar 29. Gastroenterol Clin North Am. 2014. PMID: 24813520 Free PMC article.
-
The TGFβ1 Promoter SNP C-509T and Food Sensitization Promote Esophageal Remodeling in Pediatric Eosinophilic Esophagitis.PLoS One. 2015 Dec 14;10(12):e0144651. doi: 10.1371/journal.pone.0144651. eCollection 2015. PLoS One. 2015. PMID: 26656423 Free PMC article.
-
Dietary elimination therapy is an effective option for adults with eosinophilic esophagitis.Clin Gastroenterol Hepatol. 2014 Aug;12(8):1272-9. doi: 10.1016/j.cgh.2013.12.034. Epub 2014 Jan 17. Clin Gastroenterol Hepatol. 2014. PMID: 24440337 Free PMC article.
References
-
- Furuta GT, Liacouras CA, Collins MH, Gupta SK, Justinich C, Putnam PE, et al. Eosinophilic esophagitis in children and adults: a systematic review and consensus recommendations for diagnosis and treatment. Gastroenterology. 2007;133:1342–1363. - PubMed
-
- Orenstein SR, Shalaby TM, Di Lorenzo C, Putnam PE, Sigurdsson L, Mousa H, et al. The spectrum of pediatric eosinophilic esophagitis beyond infancy: a clinical series of 30 children. Am J Gastroenterol. 2000;95:1422–1430. - PubMed
-
- Franciosi JP, Tam V, Liacouras CA, Spergel JM. A case-control study of sociodemographic and geographic characteristics of 335 children with eosinophilic esophagitis. Clin Gastroenterol Hepatol. 2009;7:415–419. - PubMed
-
- Schaefer ET, Fitzgerald JF, Molleston JP, Croffie JM, Pfefferkorn MD, Corkins MR, et al. Comparison of oral prednisone and topical fluticasone in the treatment of eosinophilic esophagitis: a randomized trial in children. Clin Gastroenterol Hepatol. 2008;6:165–173. - PubMed
Publication types
MeSH terms
Substances
Grants and funding
LinkOut - more resources
Full Text Sources
Other Literature Sources
Medical
Miscellaneous
