. 2010 Jan 13;2(14):14ra3.
doi: 10.1126/scitranslmed.3000458.

Uncovering residual effects of chronic sleep loss on human performance

Affiliations

Uncovering residual effects of chronic sleep loss on human performance

Daniel A Cohen et al. Sci Transl Med. .

Abstract

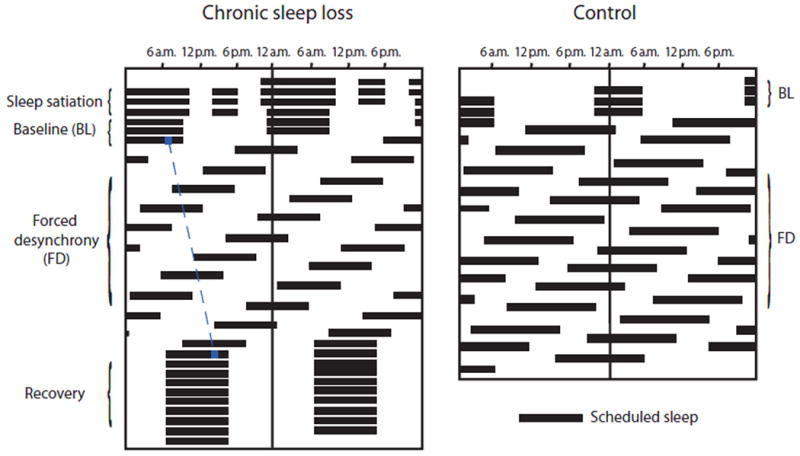
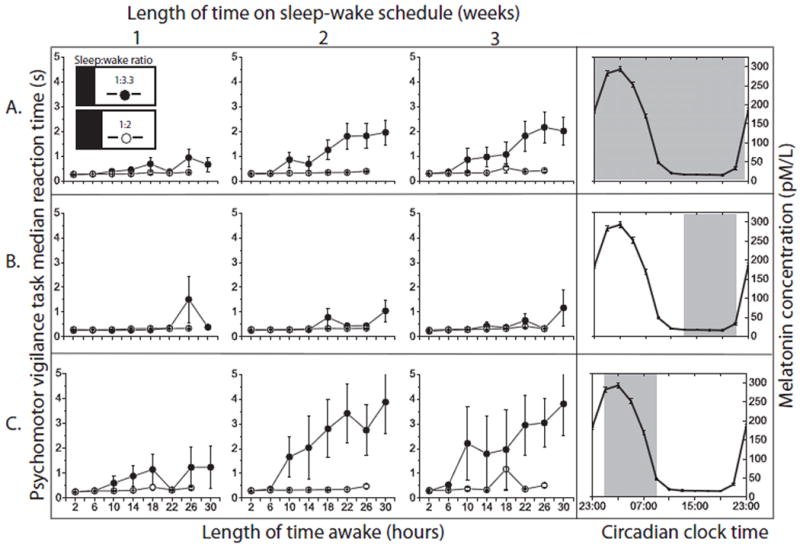
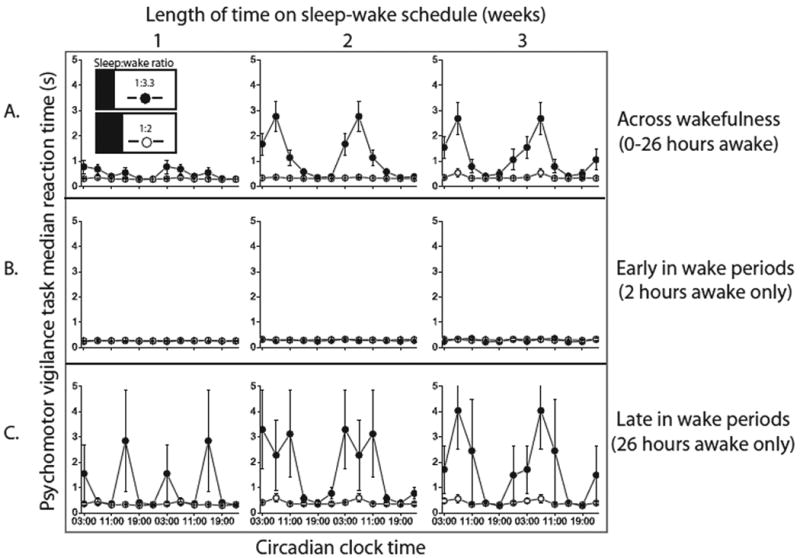
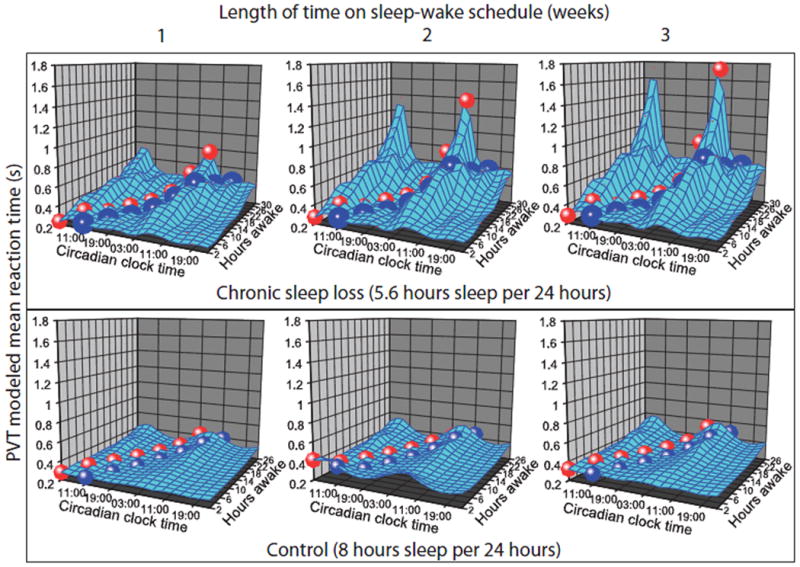
Sleep loss leads to profound performance decrements. Yet many individuals believe they adapt to chronic sleep loss or that recovery requires only a single extended sleep episode. To evaluate this, we designed a protocol whereby the durations of sleep and wake episodes were increased to 10 and 32.85 hours, respectively, to yield a reduced sleep-to-wake ratio of 1:3.3. These sleep and wake episodes were distributed across all circadian phases, enabling measurement of the effects of acute and chronic sleep loss at different times of the circadian day and night. Despite recurrent acute and substantial chronic sleep loss, 10-hour sleep opportunities consistently restored vigilance task performance during the first several hours of wakefulness. However, chronic sleep loss markedly increased the rate of deterioration in performance across wakefulness, particularly during the circadian "night." Thus, extended wake during the circadian night reveals the cumulative detrimental effects of chronic sleep loss on performance, with potential adverse health and safety consequences.


Figures

Figure 1
Figure 1. Double raster plot demonstrating the timing of sleep in the chronic sleep loss and control protocols
In a raster plot, time in hours is plotted on the horizontal axis and days on the vertical axis; in a double raster plot, two days are included on each horizontal line with the second day also plotted on the left side of the next row. Black horizontal bars indicate scheduled sleep episodes. In the chronic sleep loss protocol, participants were realigned to their habitual phase relationship between the sleep-wake and circadian cycles during the recovery (last 10 days); this was adjusted for each participant using their free-running period as determined during the FD portion of the experiment. For example, the blue dotted line represents the drift of a circadian phase marker for a subject with an endogenous circadian period of ∼24.3 hours.
Figure 2
Figure 2. Separating acute and chronic sleep homeostatic processes
Effect of consecutive hours awake on observed PVT median RT (mean and standard error of the mean). Weeks on the experimental schedule are shown from left-to-right. The graphs on the far right side show the range of circadian phases for which data are included in each row using melatonin as a phase marker of the circadian clock. During entrained baseline conditions, the melatonin maximum occurred at approximately 3am. (A) The homeostatic response across all circadian phases. (B) The homeostatic response during the circadian afternoon/early evening. (C) The homeostatic response during the late circadian night. Independent of circadian phase and across all weeks of the protocol, performance returns to near-baseline levels for at least the first six hours after waking. Chronic sleep loss (closed circles) accelerates the decline in performance over consecutive hours awake, predominantly during the late circadian night with remarkably preserved performance during the circadian afternoon/early evening. Variability is greatest with longer consecutive hours awake, weeks of chronic sleep loss, and during the late circadian night. Note that the graphs do not indicate the trajectory of an individual with increasing time awake (accompanied by change in circadian phase), but rather the theoretical homeostatic effect of increasing time awake at a fixed circadian phase. In the control group, there was a slowing of RT by approximately 30% between 2 and 26 hours awake, but this deterioration within wake episodes (at an average circadian phase) is not apparent at this scale.
Figure 3
Figure 3. Circadian rhythm of performance
Effect of circadian phase on observed PVT median RT (mean and standard error of the mean). Weeks on the experimental schedule are shown from left-to-right. (A) The circadian oscillation in performance averaged across 26 hours of wakefulness per wake episode (B) The circadian oscillation early in each wake episode at 2 hours awake (C) The circadian oscillation late in each wake episode at 26 hours awake. As can be seen in row B, across all weeks of the protocol, the amplitude of the circadian oscillation is small shortly after waking. However, chronic sleep loss (closed circles) increases the amplitude of the circadian oscillation, predominantly after extended wakefulness (row C). Chronic sleep loss alone therefore is not sufficient to appreciably increase the circadian amplitude; rather it intensifies the interaction between acute sleep loss and circadian phase. In the control group, the 116msec average peak-to-trough difference in the circadian performance rhythm (averaged across 26 hours awake) is not apparent at this scale.
Figure 4
Figure 4. Circadian and homeostatic regulation of performance
Mixed-effect statistical model predictions of PVT mean RT data at each combination of circadian phase and length of time awake within each week on the FD protocol are shown. Within each week of the chronic sleep loss protocol (top row), circadian amplitude increased with longer consecutive hours awake. Across weeks (left-to-right within each row), there was a disproportionate deterioration of performance during the late circadian night across three weeks of chronic sleep loss. Projected trajectories demonstrate the combination of consecutive hours awake and corresponding circadian time when individuals awaken at their normal entrained circadian time (blue path) and when they awaken two hours prior to the melatonin peak (red path) as may occur during jet leg or night shift schedules. The cumulative cost of chronic sleep loss is most pronounced during these conditions of circadian misalignment. The 85% average increase in predicted mean RT in the control condition between 2 hours awake during the circadian “day” and 26 hours awake during the circadian “night” is not apparent at this scale.

References

    1. Van Dongen HPA, Maislin G, Mullington JM, Dinges DF. The cumulative cost of additional wakefulness: Dose-response effects on neurobehavioral functions and sleep physiology from chronic sleep restriction and total sleep deprivation. Sleep. 2003;26:117–126. - PubMed
    1. Klein DC, Moore RY, Reppert SM. Suprachiasmatic nucleus: The mind's clock. Oxford University Press; New York: 1991.
    1. Dijk DJ, Czeisler CA. Paradoxical timing of the circadian rhythm of sleep propensity serves to consolidate sleep and wakefulness in humans. Neurosci Lett. 1994;166:63–68. - PubMed
    1. Deboer T, Detari L, Meijer JH. Long term effects of sleep deprivation on the mammalian circadian pacemaker. Sleep. 2007;30:257–262. - PubMed
    1. Dijk DJ, Duffy JF, Czeisler CA. Circadian and sleep/wake dependent aspects of subjective alertness and cognitive performance. J Sleep Res. 1992;1:112–117. - PubMed

Publication types

LinkOut - more resources