. 2010 May 28;285(22):17038-45.
doi: 10.1074/jbc.M110.104364. Epub 2010 Apr 6.

Reaction mechanism of superoxide generation during ubiquinol oxidation by the cytochrome bc1 complex

Affiliations

Reaction mechanism of superoxide generation during ubiquinol oxidation by the cytochrome bc1 complex

Ying Yin et al. J Biol Chem. .

Abstract

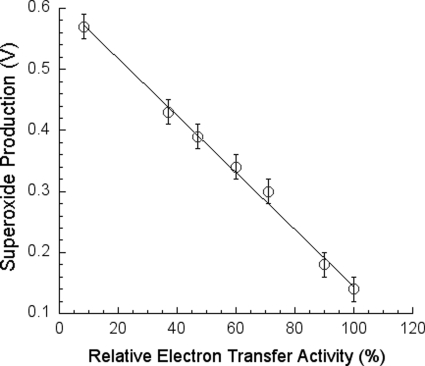
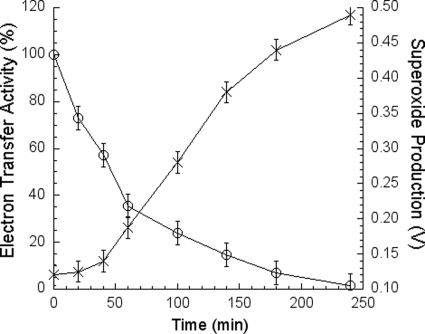
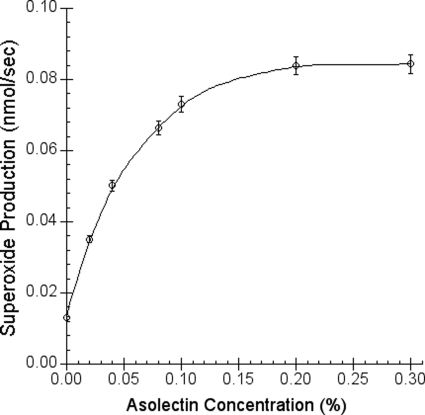
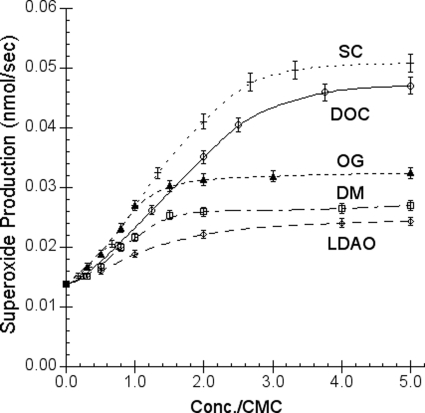
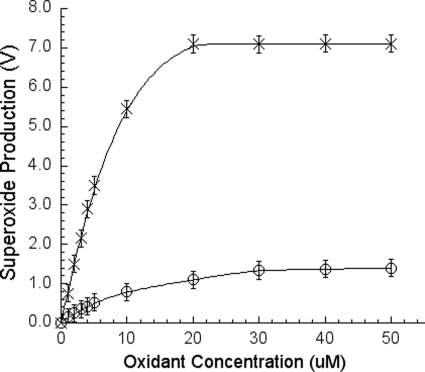
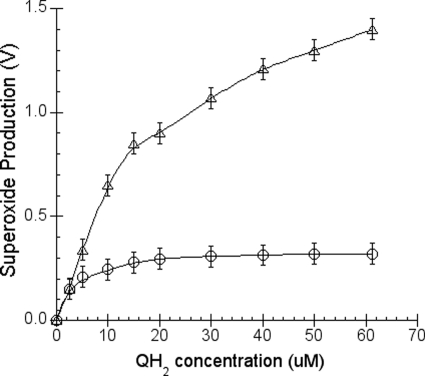
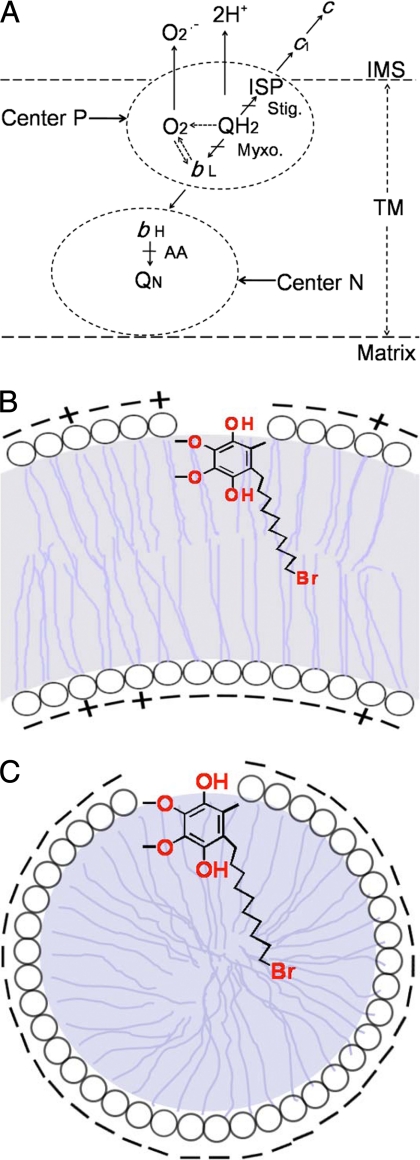
In addition to its main functions of electron transfer and proton translocation, the cytochrome bc(1) complex (bc(1)) also catalyzes superoxide anion (O(2)(*)) generation upon oxidation of ubiquinol in the presence of molecular oxygen. The reaction mechanism of superoxide generation by bc(1) remains elusive. The maximum O(2)(*) generation activity is observed when the complex is inhibited by antimycin A or inactivated by heat treatment or proteinase K digestion. The fact that the cytochrome bc(1) complex with less structural integrity has higher O(2)(*)-generating activity encouraged us to speculate that O(2)(*) is generated inside the complex, perhaps in the hydrophobic environment of the Q(P) pocket through bifurcated oxidation of ubiquinol by transferring its two electrons to a high potential electron acceptor, iron-sulfur cluster, and a low potential heme b(L) or molecular oxygen. If this speculation is correct, then one should see more O(2)(*) generation upon oxidation of ubiquinol by a high potential oxidant, such as cytochrome c or ferricyanide, in the presence of phospholipid vesicles or detergent micelles than in the hydrophilic conditions, and this is indeed the case. The protein subunits, at least those surrounding the Q(P) pocket, may play a role either in preventing the release of O(2)(*) from its production site to aqueous environments or in preventing O(2) from getting access to the hydrophobic Q(P) pocket and might not directly participate in superoxide production.


Figures

FIGURE 1.
FIGURE 1.
The relationship between the electron transfer activity and superoxide generation during temperature inactivation of cytochrome bc1 complex. 200 μl of cytochrome bc1 complex (200 μm cyt b) in 50 mm Tris-Cl, pH 8.0, containing 200 mm NaCl and 0.01% DM was incubated at 37 °C. At different time intervals, samples were withdrawn and determined for superoxide production (shown as voltage) and electron transfer activities (shown as relative electron transfer activity of the untreated complex; 100% activity is equal to 3.5 μmol of cytochrome c reduced/min/nmol of bc1 complex). Electron transfer activity and the superoxide production were measured as described under “Experimental Procedures.” Solution A contains 100 mm Na+/K+ phosphate buffer, pH 7.4, 1 mm EDTA, 1 mm NaN3, 0.1% bovine serum albumin, 0.01% DM, and 5.0 μm incubated cytochrome bc1. Solution B was the same as Solution A with bc1 complex being replaced with 125 μm Q0C10BrH2 and 4 μm MCLA. Each data point represents an average of four experiments. Error bars indicate S.D.
FIGURE 2.
FIGURE 2.
Activity tracings of the electron transfer and O2˙̄ generation during the course of proteinase K digestion of the complex. 200 μl of cytochrome bc1 complex (200 μm cyt b) in 50 mm Tris-Cl, pH 8.0, containing 200 mm NaCl and 0.01% DM was incubated with 60 μg of proteinase K at 37 °C. At the indicated time intervals, samples were withdrawn and determined for superoxide production (Xs) and electron transfer (open circles) activities. Each data point represents an average of four experiments. Error bars indicate S.D.
FIGURE 3.
FIGURE 3.
SDS-PAGE of the cytochrome bc1 complex and its proteinase K-digested products. Lane 1, intact wild-type cytochrome bc1. Lane 2, standard polypeptides. Lane 3, proteinase K-treated wild-type complex. Sub. IV, subunit IV.
FIGURE 4.
FIGURE 4.
Phospholipid vesicle concentration-dependent superoxide formation under constant amounts of cytochrome c and ubiquinol. The superoxide generation was measured by the reduction of superoxide dismutase-sensitive acetylated cytochrome c reduction as described under “Experimental Procedures.” Solution A contains 100 mm Na+/K+ phosphate buffer, pH 7.4, 10.0 μm acetylated cytochrome c, and different concentrations of asolectin vesicle. Solution B contains 0.5 mm Na+/K+ phosphate buffer, pH 4, 250 μm Q-H2 in the presence or absence of 300 units/ml superoxide dismutase. Each data point represents an average of four experiments. Error bars indicate S.D.
FIGURE 5.
FIGURE 5.
Effect of detergents on superoxide generation under constant amounts of cytochrome c and ubiquinol. The superoxide generation was measured by the reduction of superoxide dismutase-sensitive acetylated cytochrome c reduction as described under “Experimental Procedures.” Solution A contains 100 mm Na+/K+ phosphate buffer, pH 8.0, 10 μm acetylated cytochrome c, and different concentrations of detergents (LDAO, DM, OG, SC, and DOC). Solution B contains 0.5 mm Na+/K+ phosphate buffer, pH 4, 250 μm Q-H2 in the presence or absence of 300 units/ml superoxide dismutase. Each data point represents an average of four experiments. Error bars indicate S.D.
FIGURE 6.
FIGURE 6.
High potential oxidant (cytochrome c or ferricyanide) concentration-dependent superoxide generation under a constant amount of ubiquinol. The superoxide production was measured as described under “Experimental Procedures.” The curve with open circles represents cytochrome c, and the curve with Xs represents ferricyanide. Solution A contains 100 mm Na+/K+ phosphate buffer, pH 7.4, 6 mm sodium cholate, and a different concentration of cytochrome c or ferricyanide. Solution B contains 100 mm Na+/K+ phosphate buffer, pH 7.4, 6 mm sodium cholate, 50 μm Q-H2, and 4 μm MCLA. Each data point represents an average of four experiments. Error bars indicate S.D.
FIGURE 7.
FIGURE 7.
Quinol concentration-dependent superoxide production under a constant amount of sodium cholate. The superoxide production was measured as described under “Experimental Procedures.” Solution A contains 100 mm Na+/K+ phosphate buffer, pH 7.4, and 5 μm (open circles) or 50 μm (Xs) of cytochrome c. Solution B contains 100 mm Na+/K+ phosphate buffer, pH 7.4, 4 μm MCLA, 12 mm sodium cholate, and different concentrations of Q-H2. Each data point represents an average of four experiments. Error bars indicate S.D.
FIGURE 8.
FIGURE 8.
The schematic depiction of bifurcated oxidation of ubiquinol at QP pocket (A) and the proposed location of Q0C10BrH2 in the phospholipid vesicle (B) or in the detergent micelle (C). Stig., stigmatellin; Myxo, myxothiazol; AA, antimycin A; IMS, the mitochondrial intermembrane space; TM, the transmembrane region.

References

    1. Boveris A., Chance B. (1973) Biochem. J. 134, 707–716 - PMC - PubMed
    1. Loschen G., Azzi A., Flohé L. (1973) FEBS Lett. 33, 84–87 - PubMed
    1. Loschen G., Azzi A., Richter C., Flohé L. (1974) FEBS Lett. 42, 68–72 - PubMed
    1. McCord J. M., Fridovich I. (1969) J. Biol. Chem. 244, 6049–6055 - PubMed
    1. Boveris A., Oshino N., Chance B. (1972) Biochem. J. 128, 617–630 - PMC - PubMed

Publication types

LinkOut - more resources