. 2010 Jun 4;285(23):17348-58.
doi: 10.1074/jbc.M109.092791. Epub 2010 Apr 6.

Activation of AP-1 transcription factors differentiates FGF2 and vascular endothelial growth factor regulation of endothelial nitric-oxide synthase expression in placental artery endothelial cells

Affiliations

Activation of AP-1 transcription factors differentiates FGF2 and vascular endothelial growth factor regulation of endothelial nitric-oxide synthase expression in placental artery endothelial cells

Eugenia Mata-Greenwood et al. J Biol Chem. .

Abstract

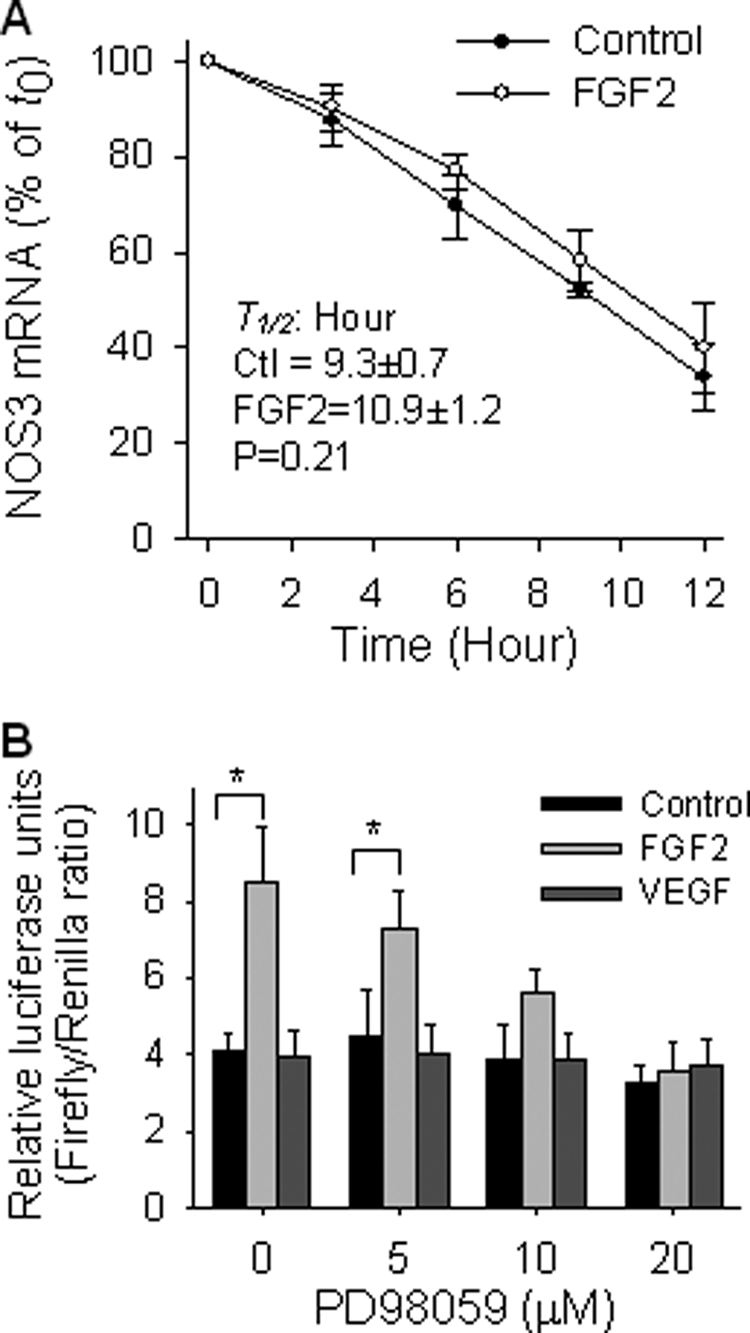
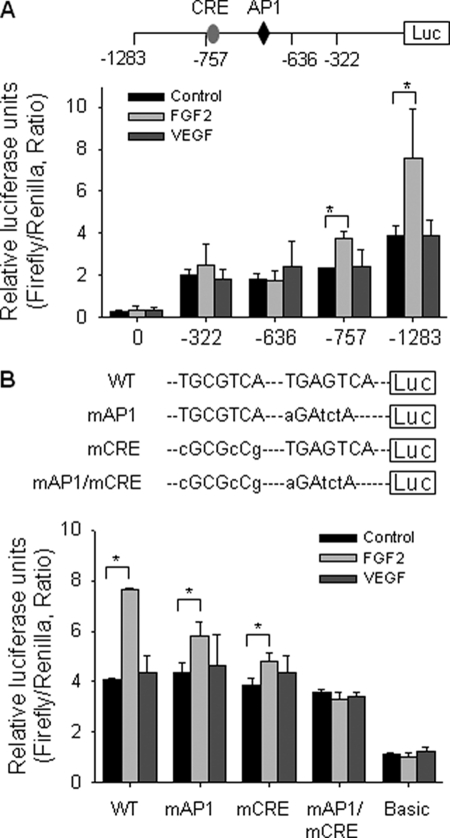
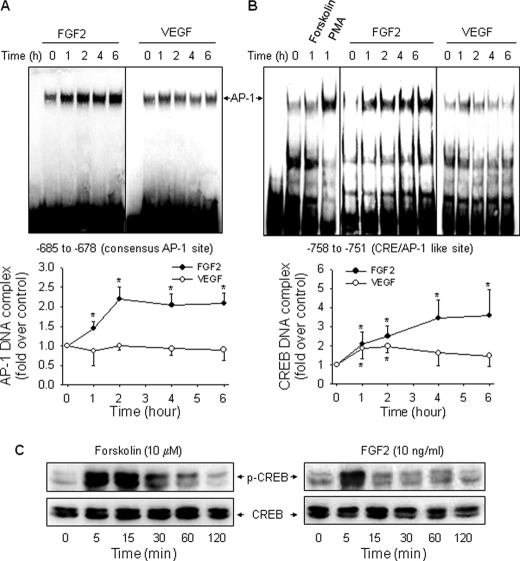
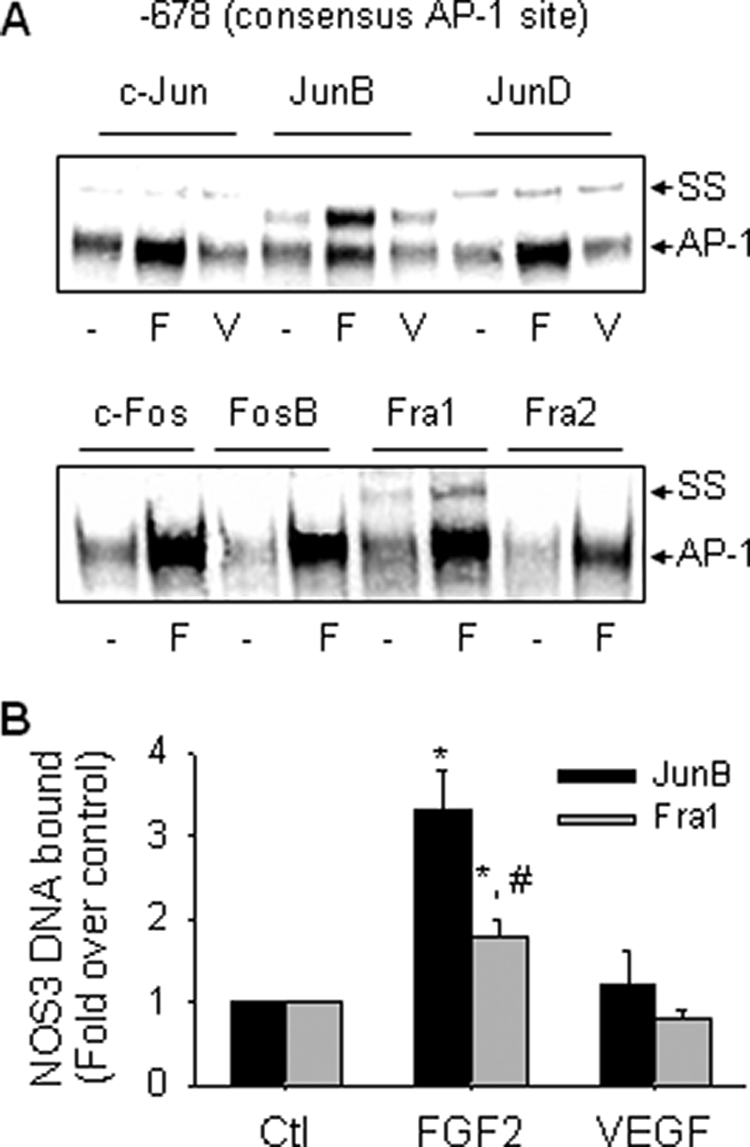
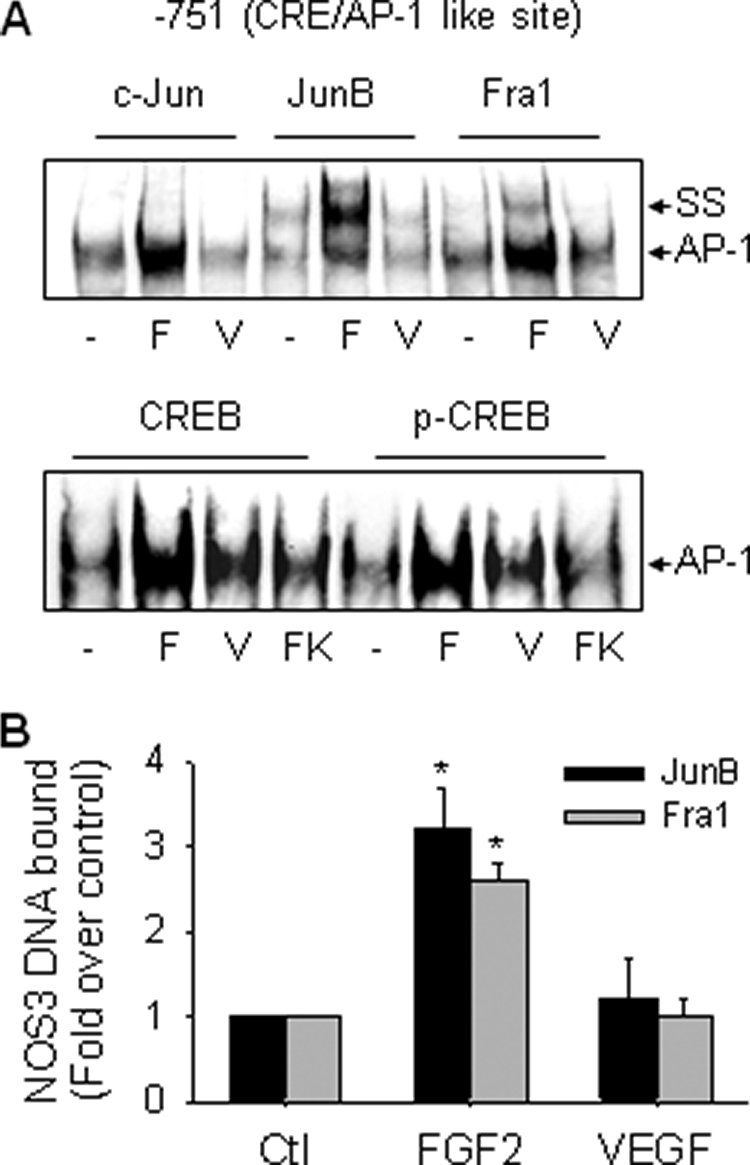
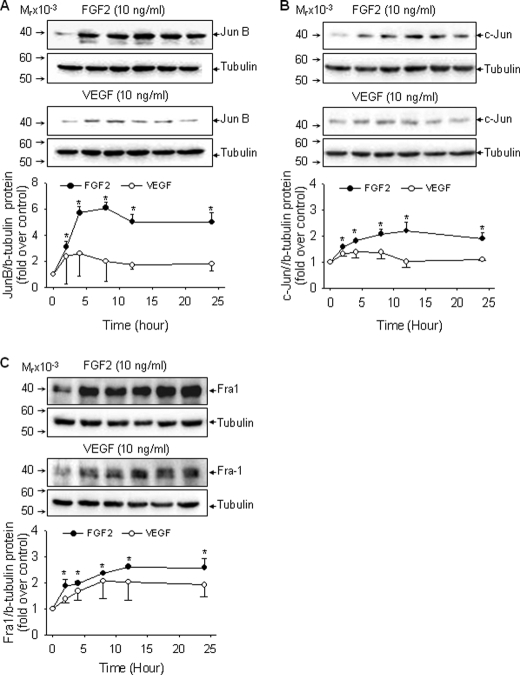
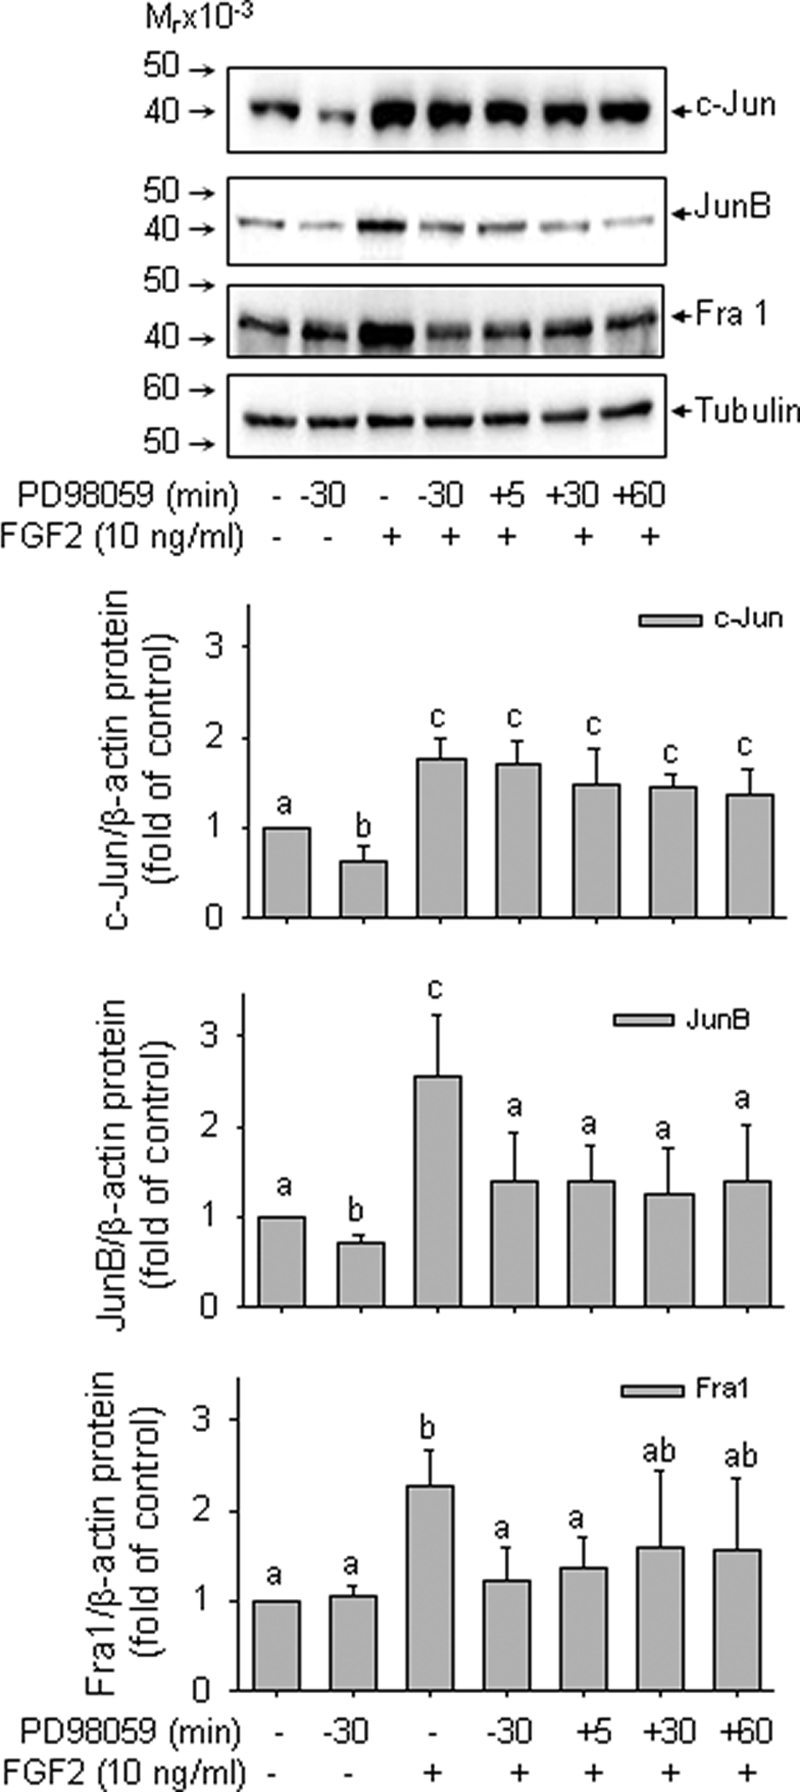
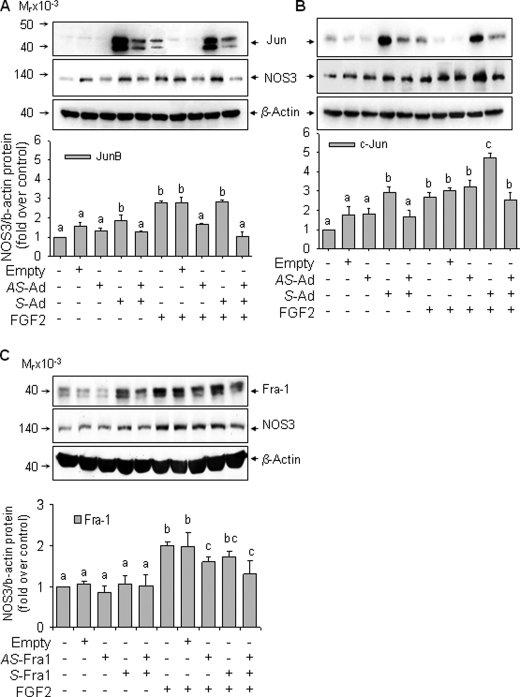
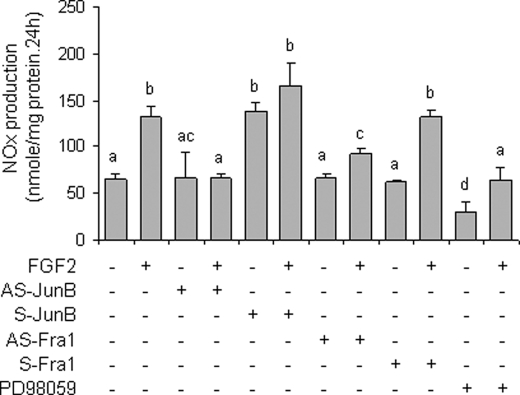
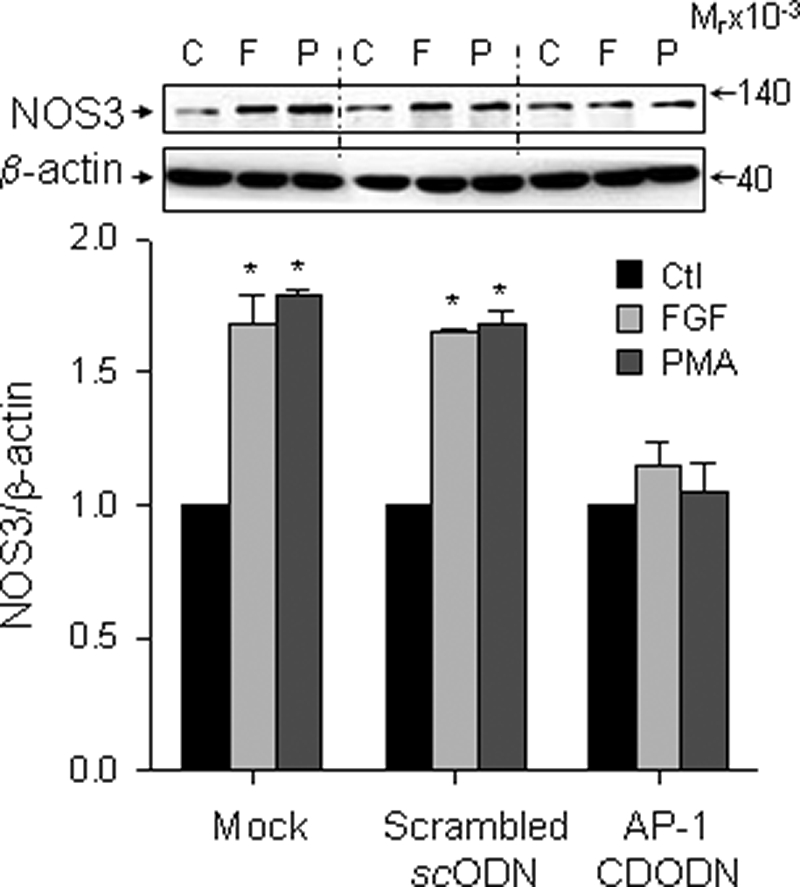
FGF2 (fibroblast growth factor 2), but not vascular endothelial growth factor (VEGF), stimulates sustained activation of ERK2/1 for endothelial NOS3 (nitric-oxide synthase 3) protein expression in ovine fetoplacental artery endothelial cells (oFPAEC). We deciphered herein the downstream signaling of ERK2/1 responsible for NOS3 expression by FGF2 in oFPAEC. FGF2, but not VEGF, increased NOS3 mRNA levels without altering its degradation. FGF2, but not VEGF, trans-activated sheep NOS3 promoter, and this was dependent on ERK2/1 activation. FGF2 did not trans-activate NOS3 promoters with deletions upstream of the consensus AP-1 site (TGAGTC A, -678 to -685). Trans-activation of wild-type NOS3 promoter by FGF2 was significantly inhibited when either the AP-1 or the cAMP-response element (CRE)-like sequence (TGCGTCA, -752 to -758) was mutated and was completely blocked when both were mutated. EMSA analyses showed that FGF2, but not VEGF, stimulated AP-1 and CRE DNA-protein complexes primarily composed of JunB and Fra1. Chromatin immunoprecipitation assays confirmed JunB/Fra1 binding to NOS3 promoter AP-1 and CRE elements in intact cells. FGF2, but not VEGF, stimulated JunB and Fra1 expressions; all preceded NOS3 up-regulation and were inhibited by PD98059. Down-regulation of JunB or Fra-1, but not c-Jun, blocked FGF2 stimulation of NOS3 expression and NO production. AP-1 inhibition suppressed FGF2 stimulation of NOS3 expression in human umbilical vein EC and uterine artery endothelial cells. Thus, FGF2 induction of NOS3 expression is mainly mediated by AP-1-dependent transcription involving JunB and Fra1 up-regulation via sustained ERK2/1 activation in endothelial cells.


Figures

FIGURE 1.
FIGURE 1.
FGF2, but not VEGF, trans-activates NOS3 promoter in oFPAEC. A, quiescent cells were treated with or without FGF2 (10 ng/ml) for 18 h. Actinomycin D (5 μg/ml) was then added into the cultures. Total RNA samples were extracted at 0, 3, 6, 9, and 12 h postactinomycin D. NOS3 and 18 S were analyzed using real time quantitative reverse transcription-PCR. Quantitative data are presented as a percentage of relative NOS3 expression at time 0. Data were summarized as mean ± S.E. from three independent experiments. B, cells were transfected with luciferase construct driven by the wild-type sheep NOS3 promoter (−1283/+22) and co-transfected with the thymidine kinase-Renilla luciferase vector. After treatment with FGF2 or VEGF (10 ng/ml) for an additional 24 h in the presence of various concentrations of PD98059, trans-activation of the NOS3 promoter was measured by luciferase reporter gene expressions as a ratio of firefly/Renilla luciferase activities, as described under “Experimental Procedures.” Quantitative data are expressed as mean ± S.E. from three independent experiments. *, p < 0.05 versus untreated control.
FIGURE 2.
FIGURE 2.
Effects of FGF2 and VEGF on NOS3 promoter trans-activation potential; role of AP-1 and CRE sites. A, deletion analyses. Cells were transfected with luciferase reporter constructs driven by the wild-type sheep NOS3 promoter (−1283/+22) or its deletions. B, site-directed mutagenesis study. Cells were transfected with the luciferase reporter construct driven by the 1305-bp NOS3 promoter of either wild type (WT) or of mutations in the AP-1, CRE, or both sites. In both panels, cells were also co-transfected with a thymidine kinase-Renilla luciferase vector as internal control. After treatment with FGF2 or VEGF (10 ng/ml) for an additional 24 h, trans-activation of NOS3 promoter was measured. Quantitative data are expressed as mean ± S.E. (error bars) (n = 3) of the ratio of firefly/Renilla luciferase activities from three independent experiments. *, p < 0.05 versus untreated control.
FIGURE 3.
FIGURE 3.
Effects of FGF2 and VEGF on DNA-protein complex formation at AP-1- and CRE-like sites. Quiescent cells were treated with VEGF or FGF2 (10 ng/ml) for 0, 1, 2, 4, and 6 h, and nuclear extracts were prepared. EMSAs were performed as described under “Experimental Procedures.” Representative EMSA images shown depict one typical experiment for the consensus AP-1 site (A) and the CRE-like site (B). Quantitative data are expressed as the mean ± S.E. (error bars) (n = 3) of -fold untreated (time 0) controls. *, p < 0.05 versus control (time 0). C, quiescent cells were stimulated with forskolin or FGF2 for various times. Total protein samples were analyzed for phosphorylated and total CREB protein levels by immunoblotting.
FIGURE 4.
FIGURE 4.
FGF2, but not VEGF, increases JunB/Fra1 binding to the consensus AP-1 site. A, oFPAEC were treated with or without 10 ng/ml FGF2 (F) or VEGF (V) for 3 h, and nuclear extracts were prepared. Supershift assays for AP-1 subunit members using an oligonucleotide probe containing the sheep NOS3 consensus AP-1 element were performed as described under “Experimental Procedures.” Representative “supershift” EMSA images shown depict similar results from three independent experiments. B, oFPAEC were treated with or without 10 ng/ml FGF2 (F) or VEGF (V) for 3 h and then used for ChIP assays. The real-time PCR signals obtained for IP with specific JunB/Fra1 antibodies were estimated with respect to input DNA, and results are expressed as mean ± S.E. (n = 3) of -fold changes over controls. *, p < 0.05 versus control. #, p < 0.05, JunB versus Fra1.
FIGURE 5.
FIGURE 5.
FGF2, but not VEGF, increases JunB/FRA1 binding to the CRE-like site. A, oFPAEC were treated with or without 10 ng/ml FGF2 (F) or VEGF (V) for 3 h. Supershift using an oligonucleotide probe containing the sheep NOS3 promoter CRE-like element was performed as described under “Experimental Procedures.” Representative supershift EMSA images shown depict similar results from three independent experiments for binding of members of the Jun/Fos families and of CREB and phospho-CREB to the CRE-like element. B, oFPAEC were treated with or without 10 ng/ml FGF2 or VEGF for 2 h and then used for ChIP assays. The real-time PCR signals obtained for IP with specific JunB/Fra1 antibodies were estimated with respect to input DNA, and results are expressed as mean ± S.E. (error bars) (n = 3) of -fold changes over controls (Ctl). *, p < 0.05 versus control.
FIGURE 6.
FIGURE 6.
Effects of FGF2 and VEGF on c-Jun, JunB, and Fra-1 protein expression in oFPAEC. Cells were treated with each growth factor (10 ng/ml) for 0, 2, 4, 8, 12, and 24 h and then harvested for immunoblotting of c-Jun (A), JunB (B), and Fra-1 (C) proteins. Representative blots shown depict one typical experiment. Quantitative data are expressed as the mean ± S.E. (error bars) (n = 3) of -fold control (untreated) value. *, p < 0.05 versus control.
FIGURE 7.
FIGURE 7.
Role of ERK2/1 in FGF2 induction of AP-1 components in oFPAEC. Serum-starved cells were either pretreated with PD98058 (10 μm) for 30 min followed by FGF2 (10 ng/ml) or treated first with FGF2 and then with PD98058 at 5, 30, and 60 min post-FGF2 treatment. Protein samples were harvested 2 h after FGF2 stimulation and analyzed for c-Jun, JunB, and Fra-1 proteins. Representative blots shown depict one typical experiment. Bar graphs summarize data (means ± S.E. (error bars)) of -fold control values from three independent experiments. Bars with different letters (a versus b versus c) differ significantly (p < 0.05), and bars with two letters do not differ from bars with either letter.
FIGURE 8.
FIGURE 8.
FGF2-increased NOS3 up-regulation requires JunB and Fra1 but not c-Jun. A, cells were infected with or without empty, antisense (AS), or sense (S) JunB adenoviruses for 18 h. After recovery in complete culture medium, cells were starved in the presence or absence of FGF2 (10 ng/ml) for 24 h. B, cells were treated similarly to A but with sense and/or antisense c-Jun adenoviruses. C, cells were treated similarly to A but with sense and/or antisense Fra1-expressing cytomegalovirus constructs. For all treatments, total protein samples were analyzed for JunB, c-Jun, Fra1, NOS3, and β-actin levels. Representative blots shown depict a typical experiment for each panel. Bar graphs summarize data (means ± S.E. (error bars)) of -fold control values from three independent experiments. Bars with different letters (a versus b versus c) differ significantly (p < 0.05), and bars with two letters do not differ from bars with either letter.
FIGURE 9.
FIGURE 9.
FGF2 increases total NOx levels in oFPAEC via JunB and ERK. Subconfluent and quiescent oFPAEC were pretreated with or without JunB adenoviruses, as shown in Fig. 8A, and Fra-1 vectors, as in Fig. 8C, or in the presence or absence of PD98059 (10 μm). The cells were then treated with FGF2 (10 ng/ml) for 24 h. Culture media were sampled for analyses of NOx production by chemiluminescence using an NO Sievers analyzer. Data were calculated by a standard curve generated by sodium nitrate. Bars with different letters (a versus b versus c versus d) differ significantly (p < 0.05), and bars with two letters do not differ from bars with either letter. Error bars, S.E.
FIGURE 10.
FIGURE 10.
FGF2 up-regulates NOS3 expression in HUVEC via AP-1. Subconfluent HUVEC were transfected with a decoy AP-1 CDODN or scrambled ODN and then treated without (C) or with FGF2 (10 ng/ml; F) or PMA (100 nm; P) for 24 h. Cellular proteins were harvested for immunoblotting of NOS3 and β-actin. Representative blots of one typical experiment shown depict three independent experiments using HUVEC from different placentas. Quantitative data are expressed as the mean ± S.E. (n = 3) of -fold control (Ctl) (untreated) value. *, p < 0.05 versus controls. Error bars, S.E.

Similar articles

Cited by

References

    1. Redman C. W., Sargent I. L. (2005) Science 308, 1592–1594 - PubMed
    1. Borowicz P. P., Arnold D. R., Johnson M. L., Grazul-Bilska A. T., Redmer D. A., Reynolds L. P. (2007) Biol. Reprod. 76, 259–267 - PubMed
    1. Zheng J., Bird I. M., Chen D. B., Magness R. R. (2005) J. Physiol. 565, 59–69 - PMC - PubMed
    1. Nelson S. H., Steinsland O. S., Wang Y., Yallampalli C., Dong Y. L., Sanchez J. M. (2000) Circ. Res. 87, 406–411 - PubMed
    1. Reynolds L. P., Caton J. S., Redmer D. A., Grazul-Bilska A. T., Vonnahme K. A., Borowicz P. P., Luther J. S., Wallace J. M., Wu G., Spencer T. E. (2006) J. Physiol. 572, 51–58 - PMC - PubMed

Publication types

Substances

LinkOut - more resources