. 2010 Aug;24(8):2962-75.
doi: 10.1096/fj.09-154054. Epub 2010 Apr 6.

Metabolomic profiling can predict which humans will develop liver dysfunction when deprived of dietary choline

Affiliations

Metabolomic profiling can predict which humans will develop liver dysfunction when deprived of dietary choline

Wei Sha et al. FASEB J. 2010 Aug.

Abstract

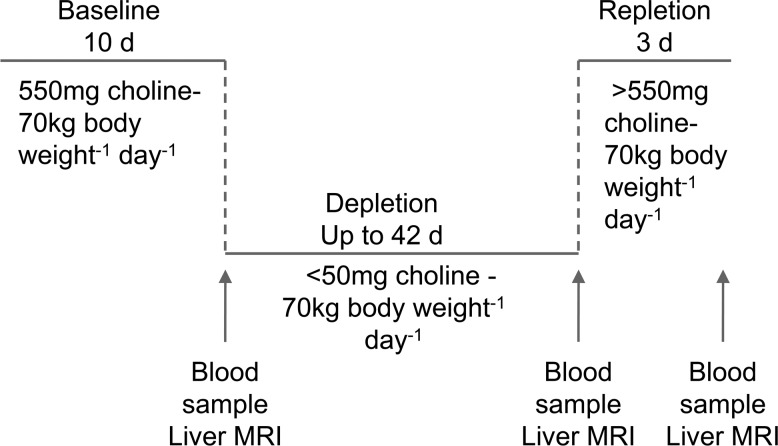
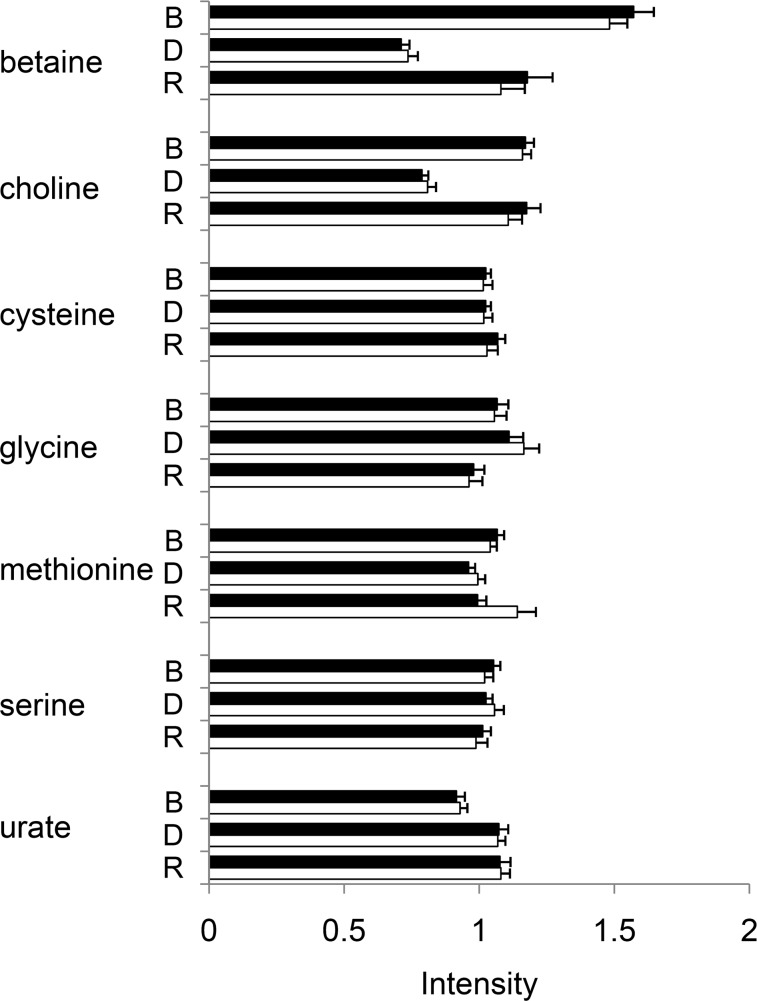
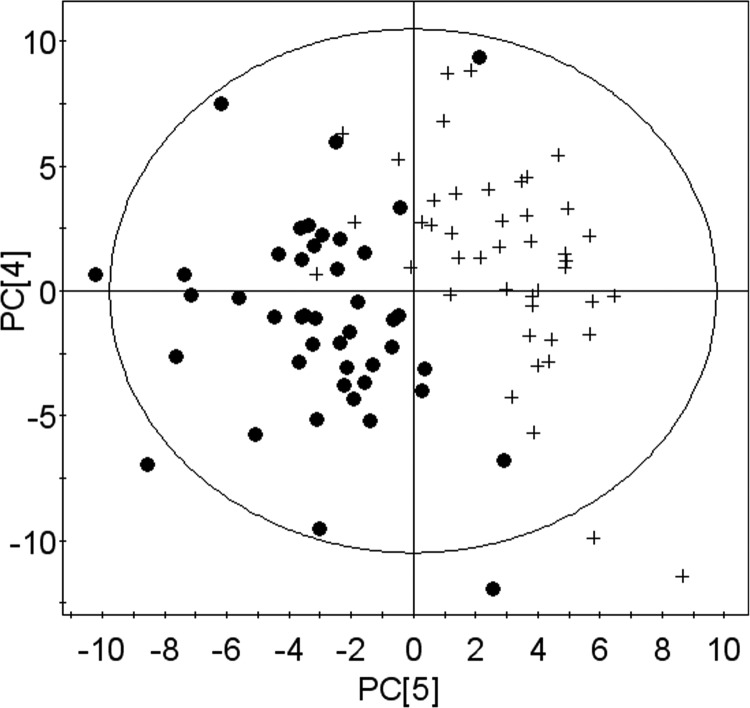
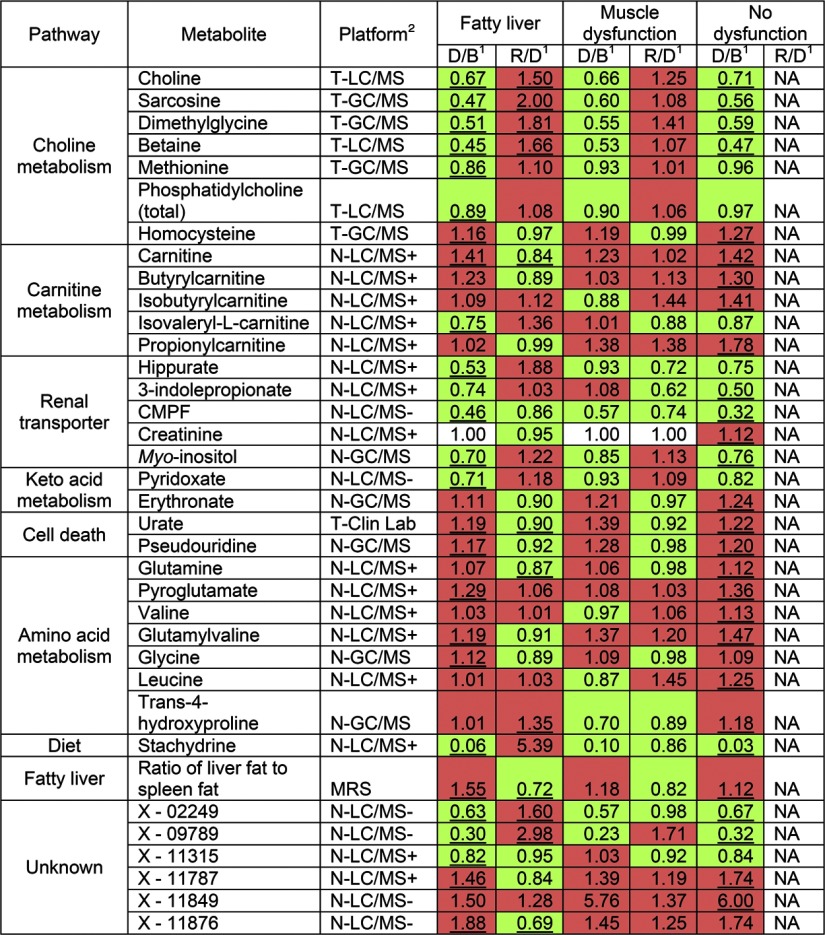
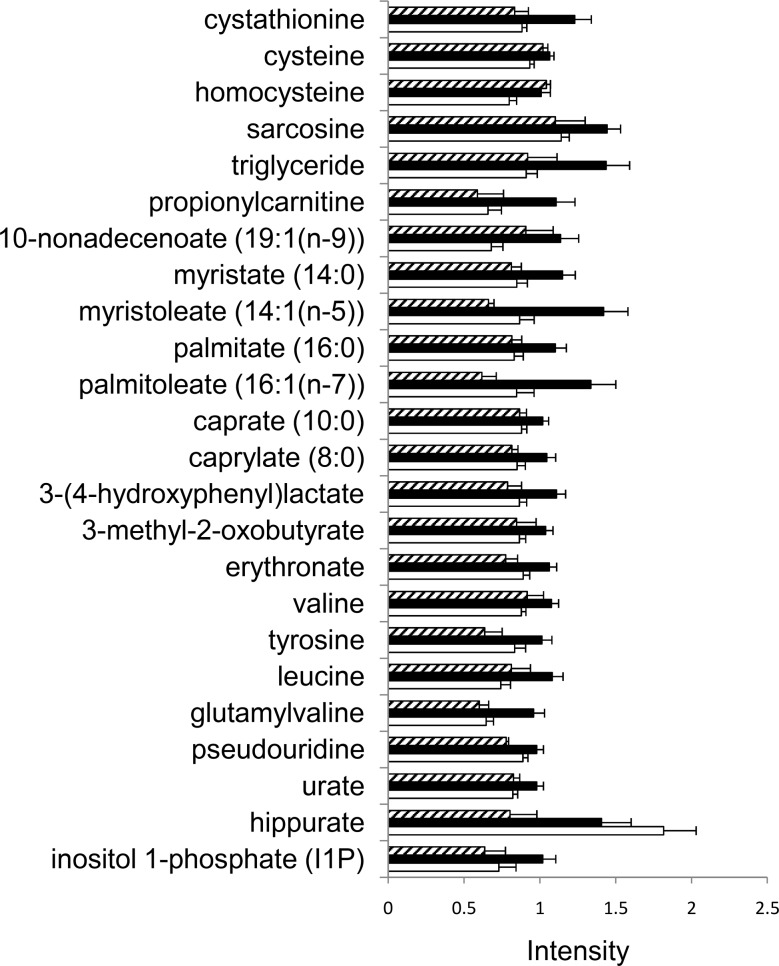
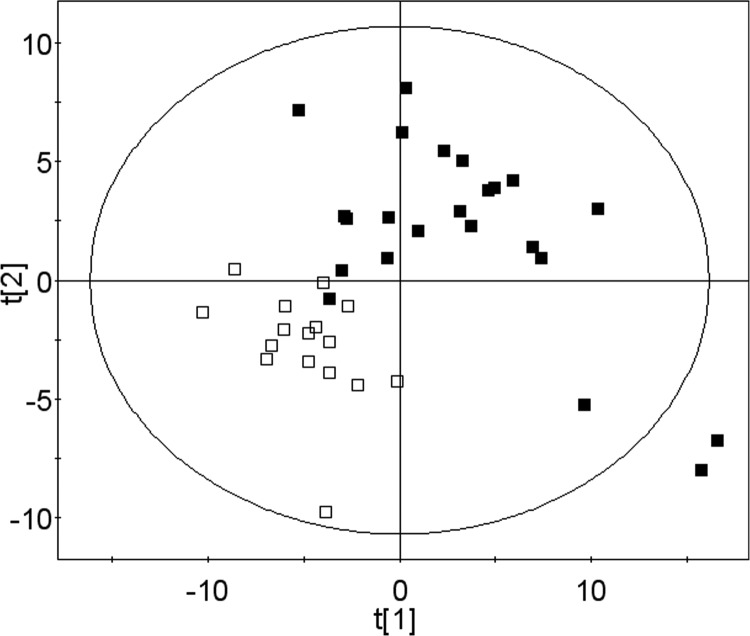
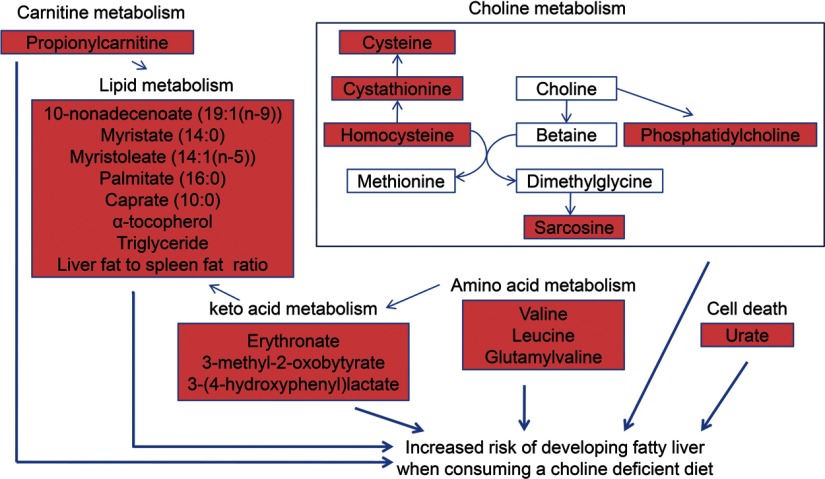
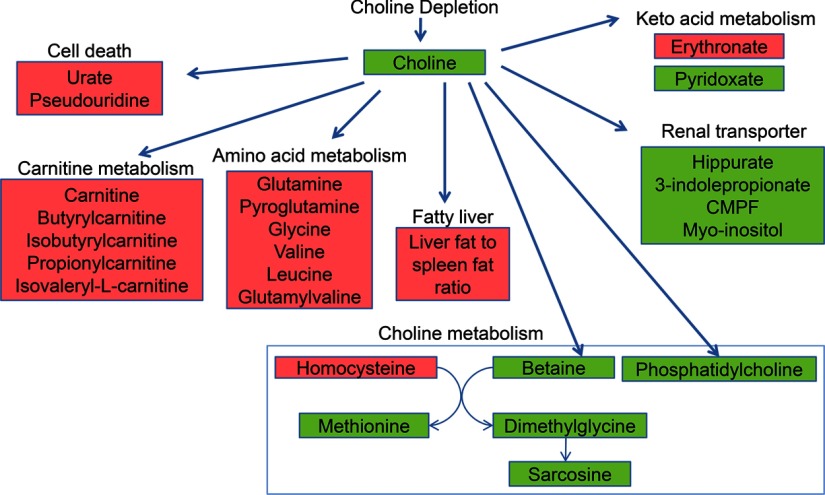
Choline is an essential nutrient, and deficiency causes liver and muscle dysfunction. Common genetic variations alter the risk of developing organ dysfunction when choline deficient, probably by causing metabolic inefficiencies that should be detectable even while ingesting a normal choline-adequate diet. We determined whether metabolomic profiling of plasma at baseline could predict whether humans will develop liver dysfunction when deprived of dietary choline. Fifty-three participants were fed a diet containing 550 mg choline/70 kg/d for 10 d and then fed < 50 mg choline/70 kg/d for up to 42 d. Participants who developed organ dysfunction on this diet were repleted with a choline-adequate diet for > or = 3 d. Plasma samples, obtained at baseline, end of depletion, and end of repletion, were used for targeted and nontargeted metabolomic profiling. Liver fat was assessed using magnetic resonance spectroscopy. Metabolomic profiling and targeted biochemical analyses were highly correlated for the analytes assessed by both procedures. In addition, we report relative concentration changes of other small molecules detected by the nontargeted metabolomic analysis after choline depletion. Finally, we show that metabolomic profiles of participants when they were consuming a control baseline diet could predict whether they would develop liver dysfunction when deprived of dietary choline.


Figures

Figure 1
Figure 1
Research design. Fifty-three participants were fed a diet containing 550 mg choline/70 kg/d for 10 d and then fed <50 mg choline/70 kg/d until they developed organ dysfunction or for up to 42 d. Participants who developed organ dysfunction consuming this diet were repleted with a choline-adequate diet for ≥3 d. Plasma and serum samples, obtained at end of baseline, end of depletion and end of repletion, were used for targeted and nontargeted metabolomic profiling.
Figure 2
Figure 2
Targeted laboratory analysis and nontargeted metabolomics analysis were highly correlated. Fifty-three participants were treated as described in Fig. 1. Shown are the 7 metabolites that were measured using both the targeted and the nontargeted analyses. Averaged intensities from targeted analysis (solid column) and nontargeted analysis (open column) of each metabolite at the end of baseline (B), depletion (D), and repletion (R) were highly correlated (r=0.95) between the two analyses. Error bar = 1 se.
Figure 3
Figure 3
PCA of metabolomic profiles separates values at end of depletion period from values at baseline. Samples were obtained and analyzed as described in Fig. 1. PCA results in a good separation of baseline values (solid circles) and depletion values (plus signs).
Figure 4
Figure 4
Metabolites that significantly changed in intensity after choline depletion in ≥1 organ dysfunction group. Human subjects were fed diets with choline, then deprived of choline, and then repleted with choline, as described in Fig. 1. Some of the subjects developed organ dysfunction (liver or muscle) when deprived of choline. Plasma samples were collected at the end of each diet period and analyzed by targeted and nontargeted biochemical assays. All named metabolites that changed significantly with FDR adjusted P < 0.05 in ≥1 organ dysfunction group are shown. Only the most significantly changed (FDR adjusted P<0.001) unknown metabolites (not identified with an authentic standard) are shown. Spectra information of these unknown metabolites is provided in Table 2. 1Fold change between depletion and baseline (D/B) and between repletion and depletion (R/D) are shown, with significant changes (FDR adjusted P<0.05) underscored. Fold change that indicates an increase by choline depletion or repletion is shaded red; change that indicates a decrease is shaded green. NA, not performed. 2Analytical platforms used for analyses are indicated by the following abbreviations: T-GC/MS, targeted GC/MS; T-LC/MS, targeted LC/MS; T-Clin Lab, targeted clinical laboratory; N-LC/MS+, nontargeted LC/MS-positive ionization; N-LC/MS−, nontargeted LC/MS negative ionization; N-GC/MS, nontargeted GC/MS; MRS, magnetic resonance spectroscopy.
Figure 5
Figure 5
Metabolites that differ among the 3 outcome phenotypes while consuming the baseline choline-adequate diet. Subjects were fed diets as described in Fig. 1, and some developed organ dysfunction (fatty liver or muscle damage) when fed a choline-deficient diet while others did not. Metabolites in plasma samples were analyzed as described in Materials and Methods. Samples were obtained at the end of the baseline choline-adequate diet period and analyzed as described in Materials and Methods. Metabolites that were different (P<0.05, equivalent to FDR 22%) among the 3 groups when they were fed the baseline choline-adequate diet are shown. Of these metabolites, several (choline metabolites, fatty acids, and amino acids) were most different in the group that would develop liver dysfunction when they were later deprived of choline. Open bar denotes no organ dysfunction group; solid bar denotes group that will develop fatty liver when fed a choline-deficient diet; hatched bar denotes group that will develop muscle dysfunction when fed a choline-deficient diet. Error bar = 1 se.
Figure 6
Figure 6
Projection to latent structure discriminant analysis (PLS-DA) of metabolomic profiles while fed the baseline choline-adequate diet separates participants who will develop fatty liver from participants who will not develop organ dysfunction when fed a choline-deficient diet. Samples were obtained at the end of the baseline choline-adequate diet period and analyzed as described in Fig. 1. Using baseline data, PLS-DA provides a good separation of the group that will develop fatty liver (solid squares) from those who will not develop organ dysfunction (open squares) when fed a choline-deficient diet. Metabolites used for this separation are shown in Table 1.
Figure 7
Figure 7
Molecules identified by metabolomic profiling at baseline that predicted the risk of developing fatty liver when fed a choline-deficient diet. Samples were obtained and analyzed as described in Fig. 1. Results at baseline that predicted the risk of developing fatty liver when fed a choline-deficient diet are summarized by grouping metabolites into shared metabolic pathways. Metabolites whose levels increased (red) or did not change (white) are shown.
Figure 8
Figure 8
Molecules identified by metabolomic profiling that were significantly changed at the end of choline depletion as compared to baseline values. Samples were obtained and analyzed as described in Fig. 1. Results that were significantly changed at the end of choline depletion as compared to baseline values are summarized by grouping metabolites into shared metabolic pathways. Metabolites whose levels increased (red) or decreased (green) are shown.

Similar articles

Cited by

References

    1. Zeisel S. H. Choline: critical role during fetal development and dietary requirements in adults. Annu Rev Nutr. 2006;26:229–250. - PMC - PubMed
    1. Niculescu M. D., Zeisel S. H. Diet, methyl donors and DNA methylation: interactions between dietary folate, methionine and choline. J Nutr. 2002;132:2333S–2335S. - PubMed
    1. Finkelstein J. D. Pathways and regulation of homocysteine metabolism in mammals. Semin Thromb Hemost. 2000;26:219–225. - PubMed
    1. Kim Y. I., Miller J. W., da Costa K. A., Nadeau M., Smith D., Selhub J., Zeisel S. H., Mason J. B. Folate deficiency causes secondary depletion of choline and phosphocholine in liver. J Nutr. 1995;124:2197–2203. - PubMed
    1. Selhub J., Seyoum E., Pomfret E. A., Zeisel S. H. Effects of choline deficiency and methotrexate treatment upon liver folate content and distribution. Cancer Res. 1991;51:16–21. - PubMed

Publication types