

Comparative Study
doi: 10.1523/JNEUROSCI.3456-09.2010.
A common progenitor for retinal astrocytes and oligodendrocytes
Affiliations
- PMID: 20371817
- PMCID: PMC3536471
- DOI: 10.1523/JNEUROSCI.3456-09.2010
Item in Clipboard
Comparative Study
A common progenitor for retinal astrocytes and oligodendrocytes
J Neurosci.
.
Abstract
Developing neural tissue undergoes a period of neurogenesis followed by a period of gliogenesis. The lineage relationships among glial cell types have not been defined for most areas of the nervous system. Here we use retroviruses to label clones of glial cells in the chick retina. We found that almost every clone had both astrocytes and oligodendrocytes. In addition, we discovered a novel glial cell type, with features intermediate between those of astrocytes and oligodendrocytes, which we have named the diacyte. Diacytes also share a progenitor cell with both astrocytes and oligodendrocytes.
Figures
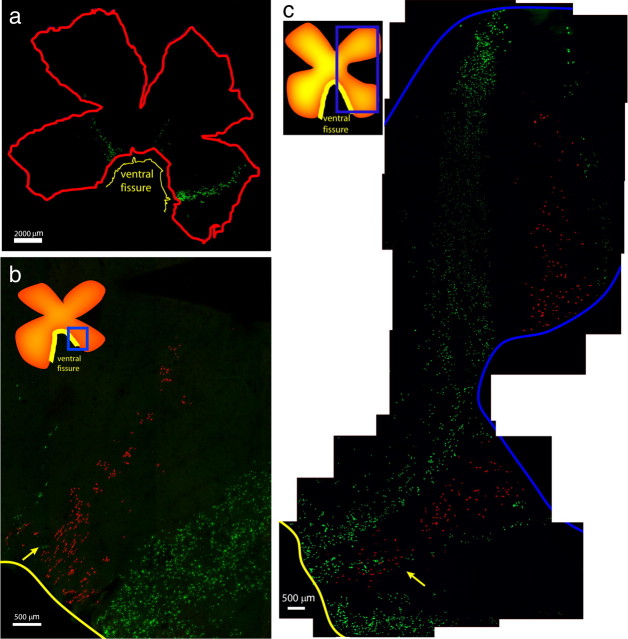
Chick retinal glial clones. a, Whole-mount view of an E3 infected retina (231-2R) harvested at E20, showing glial clones of different sizes and shapes. Scale bar, 2000 μm. b, Retina (231-2R) showing a small tdTomato+ clone flanked by two GFP+ clones, with small degree of overlap in which the cells have exited the ventral fissure (yellow arrow). Scale bar, 500 μm. c, Retina (230-2R) showing two large GFP+ clones flanking a single tdTomato+ clone that overlaps with one of the GFP+ clones, close to the ventral fissure (yellow arrow). Scale bar, 500 μm. Insets show diagrams of the retina, with boxed areas indicating the areas occupied by the glial clones, which were imaged at higher resolution. Yellow line indicates ventral fissure.
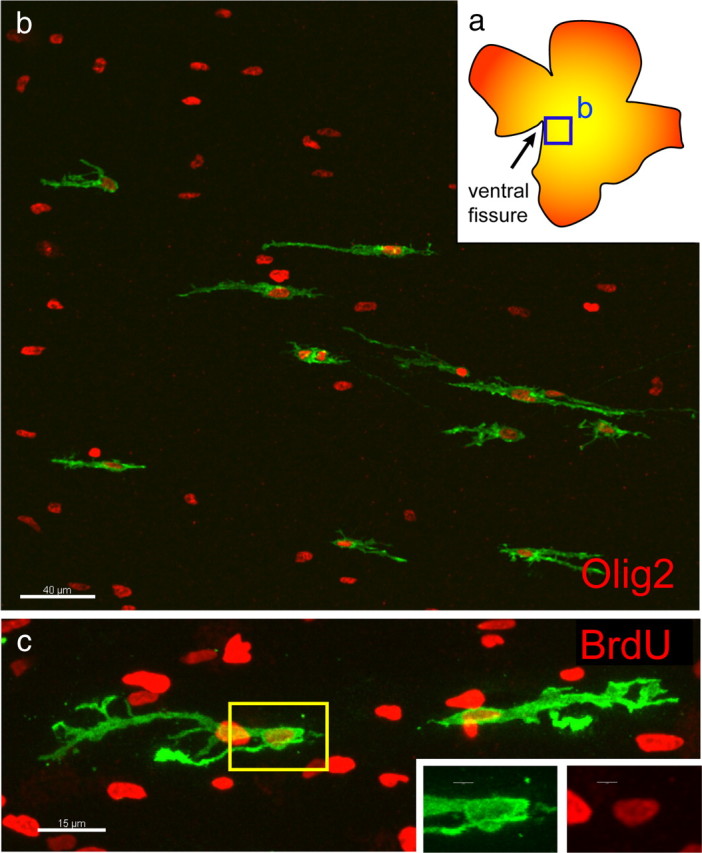
Early glial cell migration and cell division. a, Diagram of retina imaged in b showing region close to the optic nerve head in which GFP+ cells could be seen. b, GFP+ cells derived from an E3 infection, harvested at E12, expressed Olig2 (red). Scale bar, 40 μm. c, E3 infected chick retina explanted for 1 d in vitro at E12 in the presence of BrdU (red), indicating that glial cells underwent S phase as they migrated. Yellow box indicates inset area. Scale bars: c, 15 μm; inset, 3 μm.
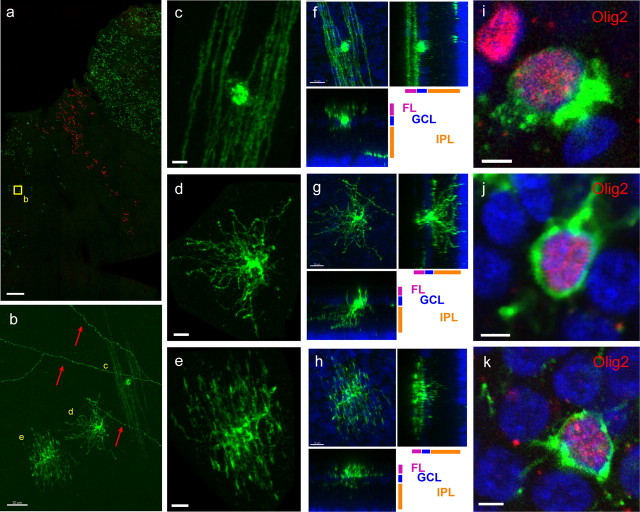
Morphology and Olig2 expression of GFP+ cells in glial clones. a, Low-magnification view of three glial clones, two expressing GFP and one expressing tdTomato. Yellow box indicates location of cells shown in b. Retina infected at E3 and harvested at E20. Scale bar, 500 μm. b, Examples of the three morphologically distinct types of cells in the inner retina at E20, shown in more detail in c–e. Red arrows indicate IPL processes from infected brain neurons that project axons into the retina. Scale bars, 20 μm. c, GFP+ cell exhibiting oligodendrocytic morphology. d, GFP+ cell exhibiting astrocytic morphology. e, GFP+ cell exhibiting morphology that is intermediate to those of an astrocyte and an oligodendrocyte. f, Oligodendrocyte-like GFP+ cell at P8/9, together with orthogonal projections showing two side views. g, Astrocyte-like GFP+ cell at P8/9 with orthogonal projections showing two side views. h, GFP+ cell with intermediate morphology, with orthogonal projections showing two side views. i, Oligodendrocyte-like GFP cell positive for Olig2 (red). j, Astrocyte-like GFP cell positive for Olig2 (red). k, GFP cell with intermediate morphology, positive for Olig2 (red). Scale bars: c–h, 10 μm; i–k, 3 μm. Green indicates GFP.
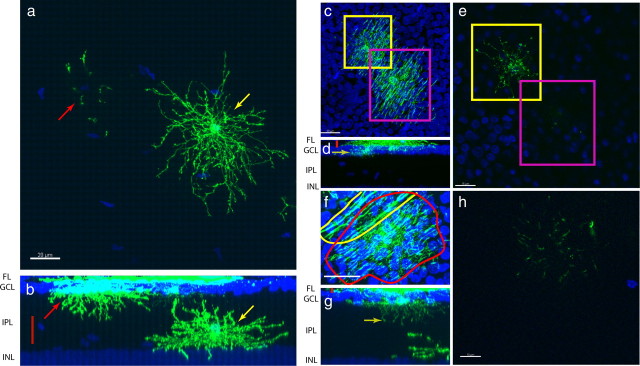
Post-hatch migration of astrocytes into the IPL and variable diacyte projection into the IPL. a, MIP of an IPL astrocyte (yellow arrow) and processes of an astrocyte with a cell body in the GCL (red arrow). b, Cross-sectional MIP showing GCL astrocyte (red arrow), IPL astrocyte (yellow arrow), and area shown in a (red bar). Scale bar, 20 μm. c, MIP of two diacytes observed from the fiber layer, highlighted in the yellow and magenta boxes. d, Cross-sectional MIP showing the area imaged in c, red bar. Yellow arrow indicates the single confocal slice shown in e. e, Single confocal slice showing one of the cells extending very short processes into the IPL (the yellow-boxed cell in c), whereas the other cell did not extend any processes into the IPL (the magenta-boxed cell). f, MIP of a diacyte (red outline) and an oligodendrocyte (yellow outline). g, Cross-sectional MIP of a diacyte extending processes deep into the IPL. Red bar indicates area depicted in f. Yellow arrow indicates slice shown in h. h, Single confocal slice deep in the IPL showing extensive diacyte processes in the IPL. Scale bars: a, d, 20 μm; c, 15 μm; f, 10 μm. INL, Inner nuclear layer.
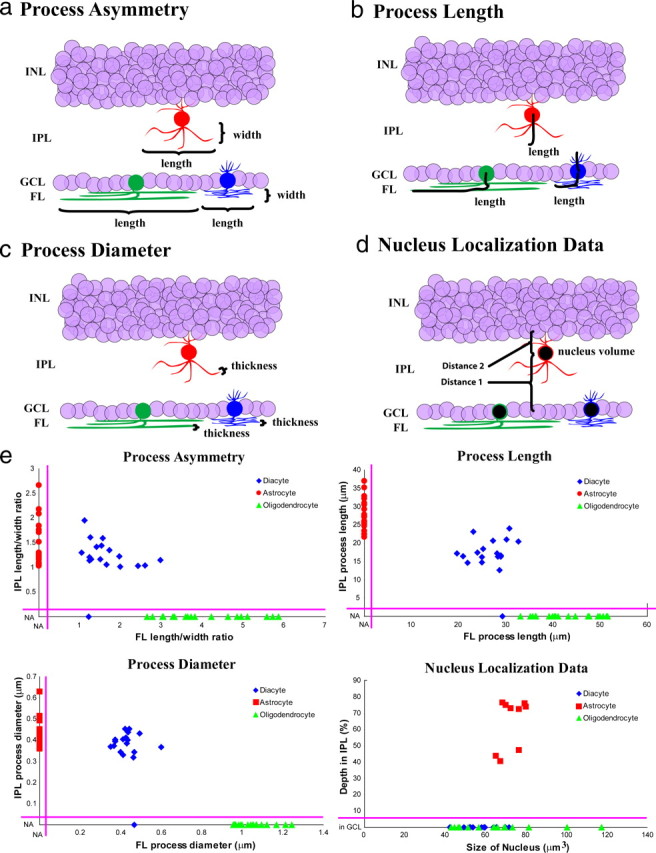
Quantification of glial characteristics. a, Diagram demonstrating process asymmetry (length divided by width), which was measured for processes in the IPL or FL for each cell type. b, Process length for each cell type for their processes in either the IPL or FL. c, Process diameter for each cell type for processes in the IPL or FL. d, Nucleus localization data for each cell type showing depth of the nucleus in the IPL [distance 1/(distance 1 + distance 2)] as well as nucleus size in cubic micrometers. e, Two-dimensional scatter plots of quantified cell morphology. Top left, IPL length/width ratio plotted against FL length/width ratio. Top right, IPL process length plotted against FL process length. Bottom left, IPL process diameter plotted against FL process diameter. Bottom right, Percentage depth in IPL plotted against size of nucleus. Red, Astrocytes; green, oligodendrocytes; blue, diacytes; NA, not applicable (i.e., FL process width for cells without FL processes). INL, Inner nuclear layer.
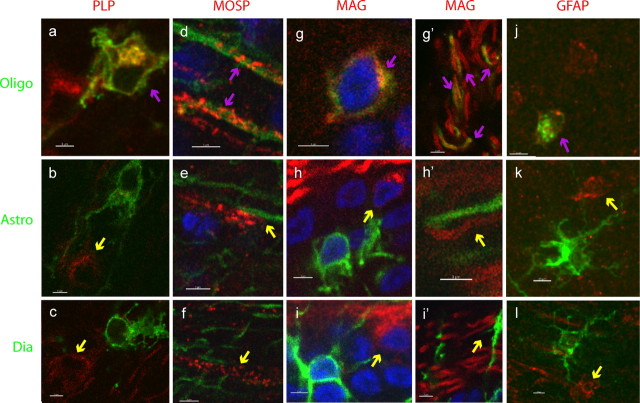
Markers expressed by retinal glial cells. Expression of glial markers in the three morphological types of glial cells, marked by GFP. Oligodendrocyte morphology (a, d, g, g′, j), astrocyte morphology (b, e, h, h′, k), and intermediate morphology (diacyte) (c, f, i, i′, l). Antigens are indicated in column headings and are shown in red. Magenta arrows indicate colocalized signals, and yellow arrows indicate non-colocalization. Scale bar, 3 μm.
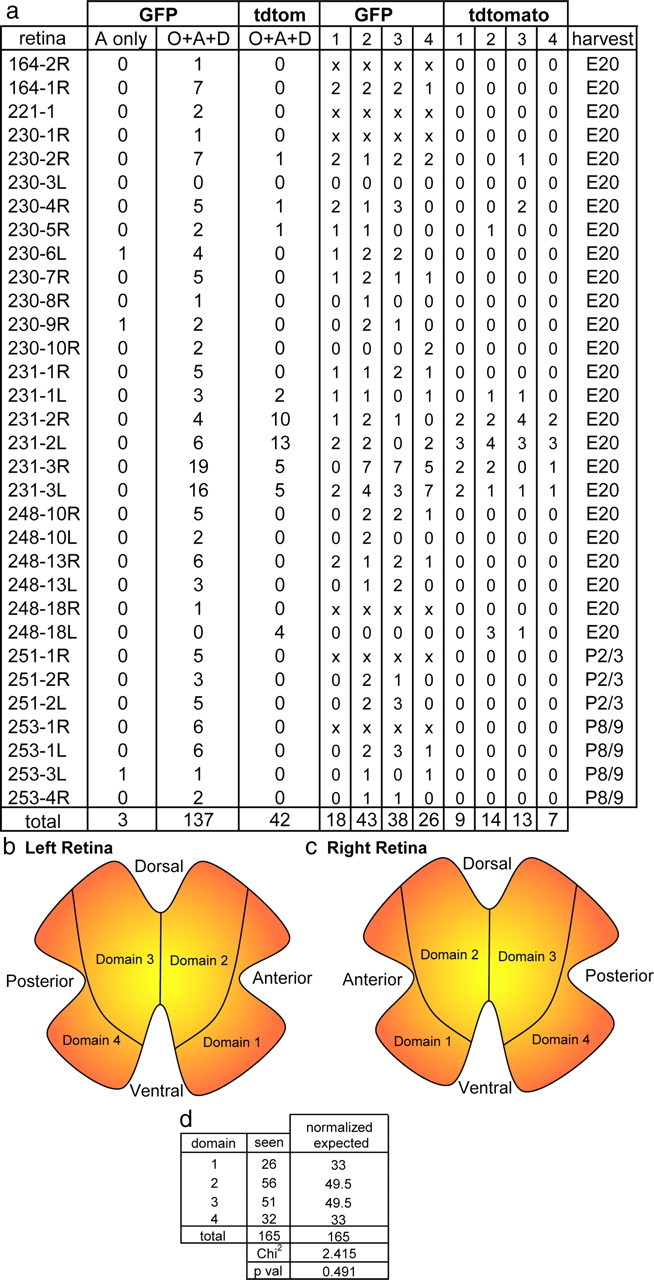
Quantification of glial clones. a, Column labeled “retina” lists the experiment number and retina number. The numbers of GFP and tdTomato clones in each retina are listed as astrocyte-only clones or clones with all three glial cell types (clones with other combinations of cell types were not observed). Also shown is the number of clones per domain of the retina (key in b and c) and age of harvest. Retinas whose domains were unable to be determined because of fragmentation of the retinal whole mounts are denoted by “x” on each domain. All retinas were derived from E3 infections. b, c, Delineation of the four domains for the left (b) and right (c) retina, with domains drawn to mimic shapes of clones. d, Statistical analysis of number of glial clones per domain in the retina, normalized for expected clone distribution based on domains 2 and 3 being 50% larger than domains 1 and 4. O, Oligodendrocyte; A, astrocyte; D, diacyte.
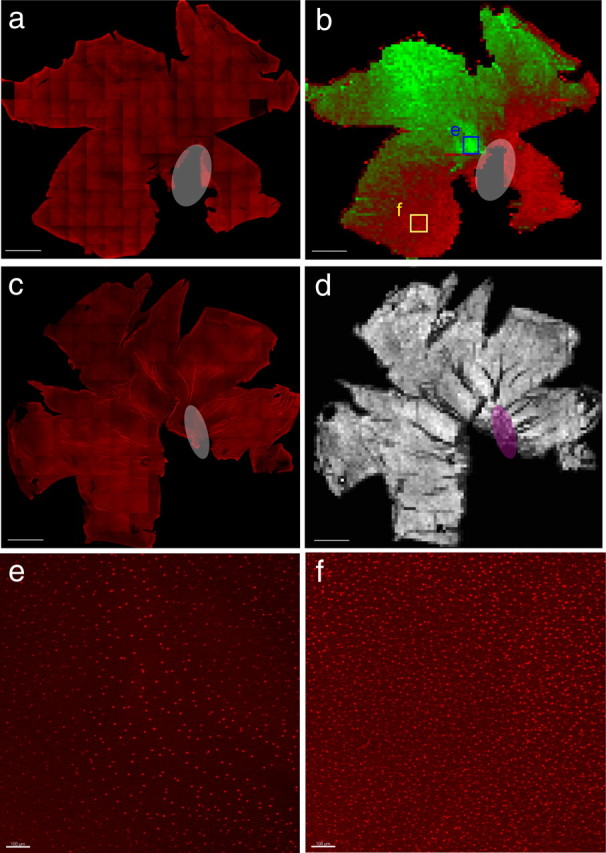
Quantification of Olig2 and neurofilament staining in the P8/9 chick retina. a, Tiled confocal image of the chick P8/9 retina stained for Olig2 (red). b, Pseudocoloring of the automated quantification of Olig2+ cells on the vitreal surface of the retina. Red indicates relatively higher Olig2+ cell density, and green indicates relatively lower cell density. Note the ventral high Olig2 density and dorsal low Olig2 density as well as the spot (outline) in the central retina of very low Olig2 density. The red rim surrounding the retina is an automated quantification artifact. Each pixel corresponds to a single quantified bin and is equivalent to an ∼150 × 150 μm area of the retina. c, Tiled confocal image of the chick P8 retina stained for neurofilament to mark retinal ganglion cell axons (red). d, Quantification of the number of filaments on the vitreal surface of the retina shown with black being low and white being high, indicating no significant difference in the number of axonal fascicles throughout the retina. Each pixel is also equivalent to an ∼150 × 150 μm area of the retina and corresponds to a single quantification bin. Scale bar, 2500 μm. White and magenta ovals indicate ventral fissure. e, MIP corresponding to blue box in b. Scale bar, 100 μm. f, MIP corresponding to yellow box in b. Scale bar, 100 μm.
References
-
- Cai J, Qi Y, Hu X, Tan M, Liu Z, Zhang J, Li Q, Sander M, Qiu M. Generation of oligodendrocyte precursor cells from mouse dorsal spinal cord independent of Nkx6 regulation and Shh signaling. Neuron. 2005;45:41–53. - PubMed
-
- Cai J, Chen Y, Cai WH, Hurlock EC, Wu H, Kernie SG, Parada LF, Lu QR. A crucial role for Olig2 in white matter astrocyte development. Development. 2007;134:1887–1899. - PubMed
-
- Cepko CL, Pear WS. In: Current protocols in molecular biology. Ausubel FM, Brent R, Kingston RE, Moore DD, Seidman JG, Smith JA, Struhl K, editors. Hoboken, NJ: Greene; 1997. pp. 9.9–9.14.
-
- Chan-Ling T, Chu Y, Baxter L, Weible Ii M, Hughes S. In vivo characterization of astrocyte precursor cells (APCs) and astrocytes in developing rat retinae: differentiation, proliferation, and apoptosis. Glia. 2009;57:39–53. - PubMed
Publication types
MeSH terms
Grants and funding
LinkOut - more resources
Full Text Sources
Medical