. 2010 May;36(5):1067-80.
doi: 10.3892/ijo_00000588.

Estradiol-induced proliferation of papillary and follicular thyroid cancer cells is mediated by estrogen receptors alpha and beta

Affiliations

Estradiol-induced proliferation of papillary and follicular thyroid cancer cells is mediated by estrogen receptors alpha and beta

Akhilesh Kumar et al. Int J Oncol. 2010 May.

Abstract

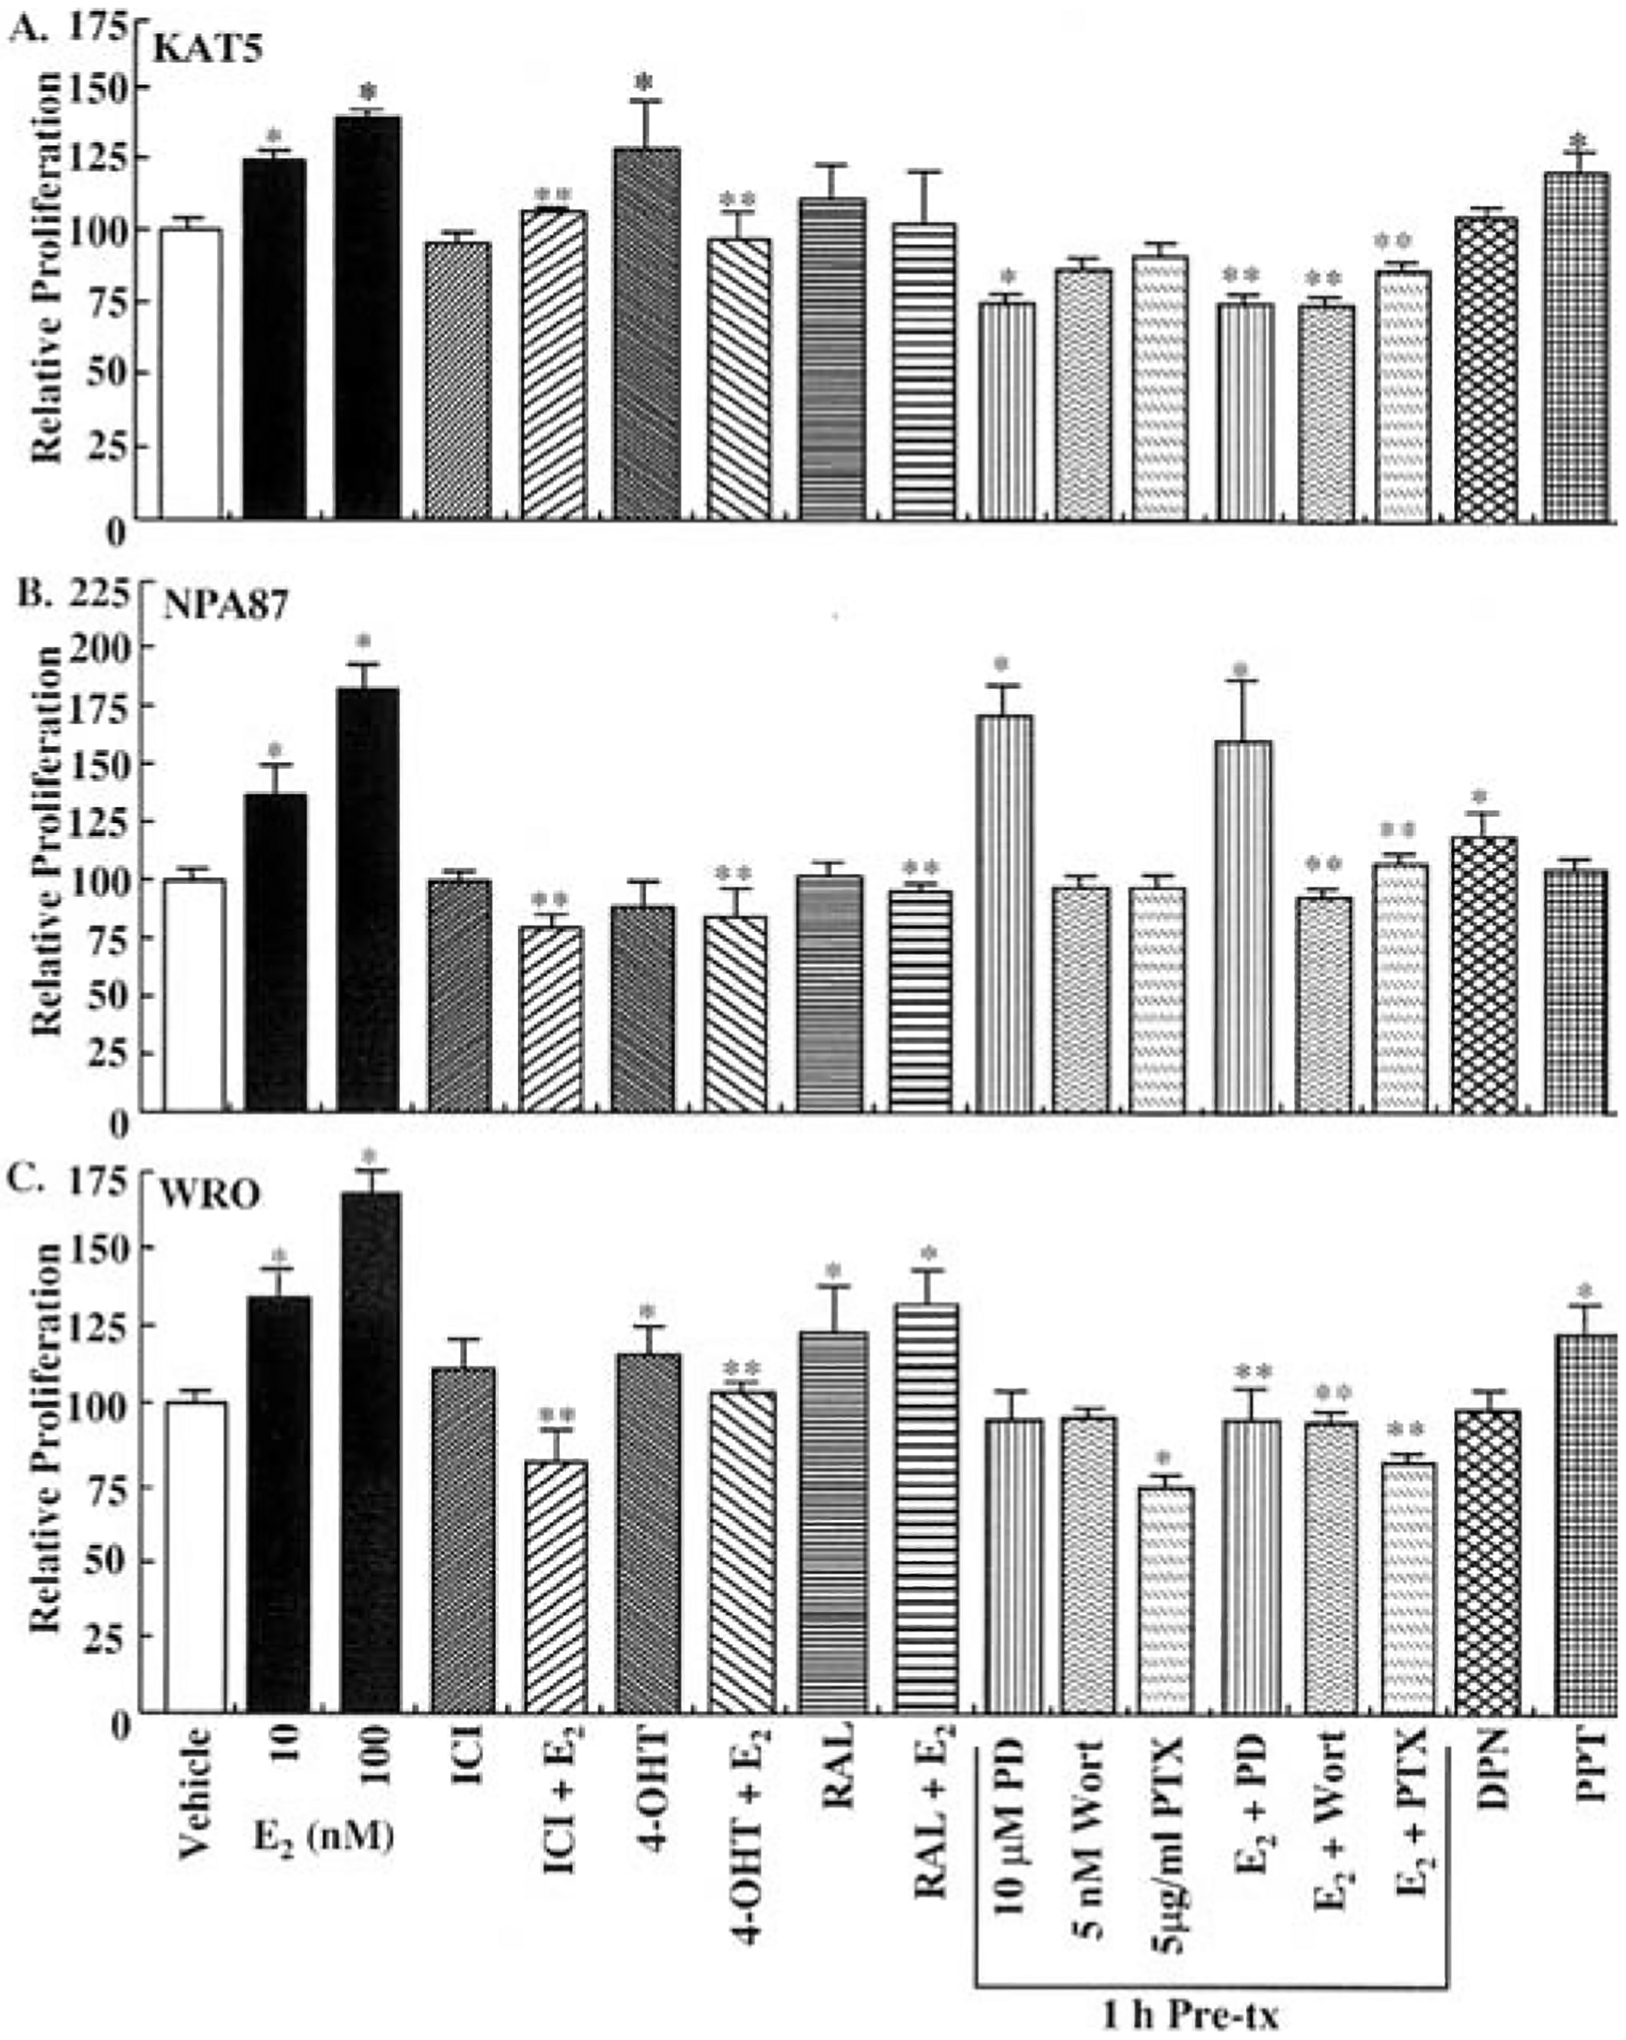
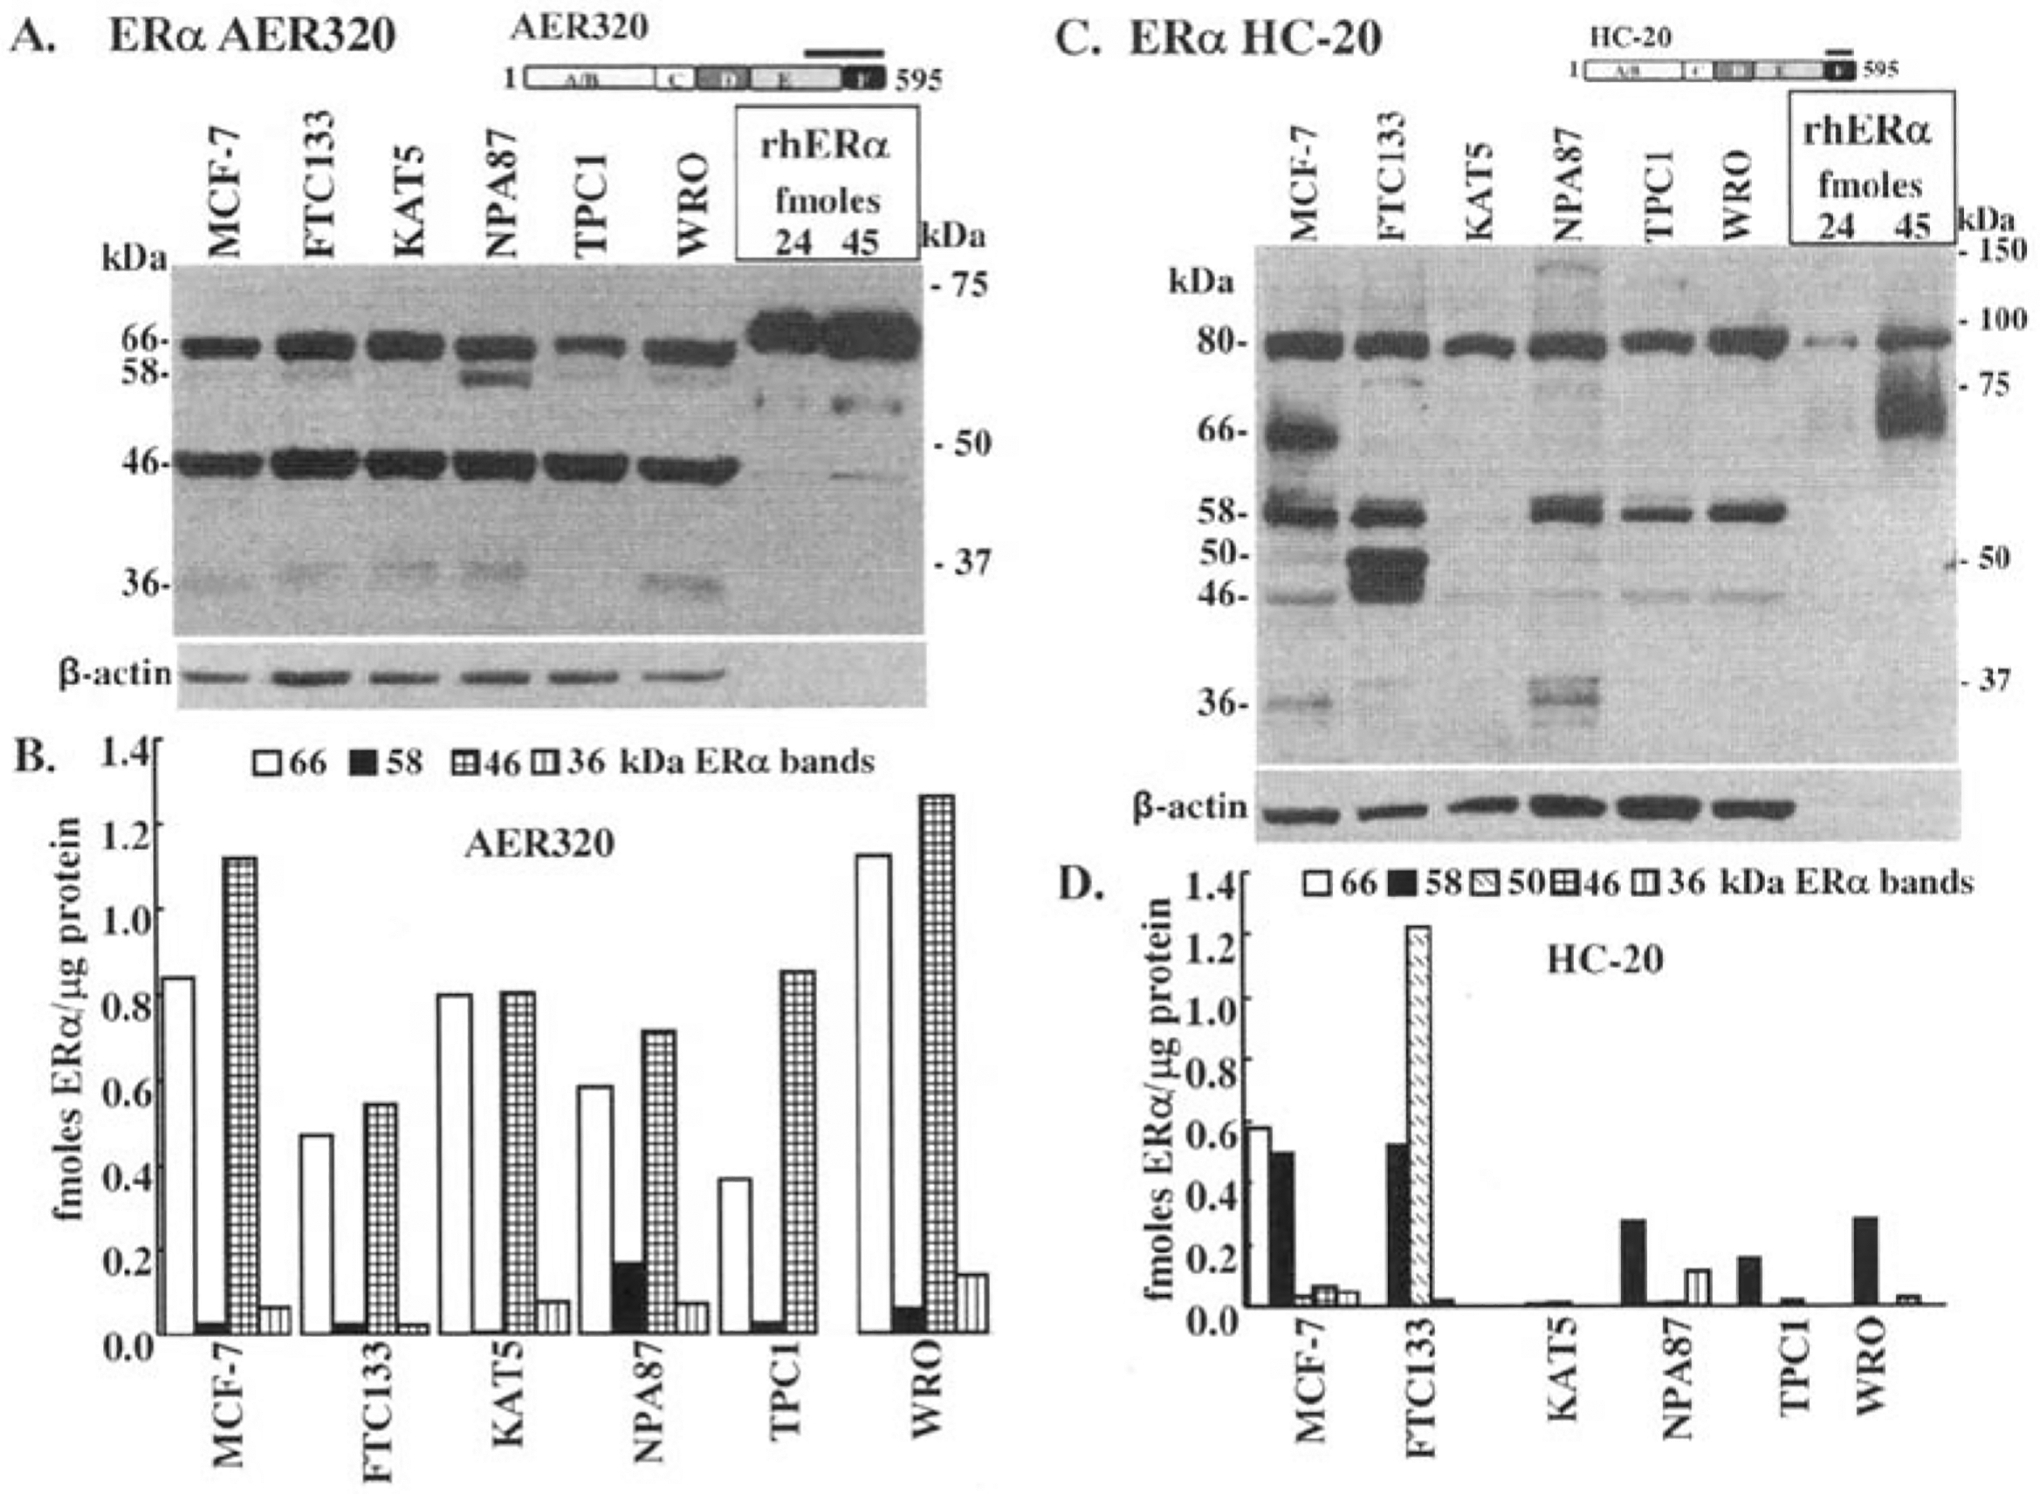
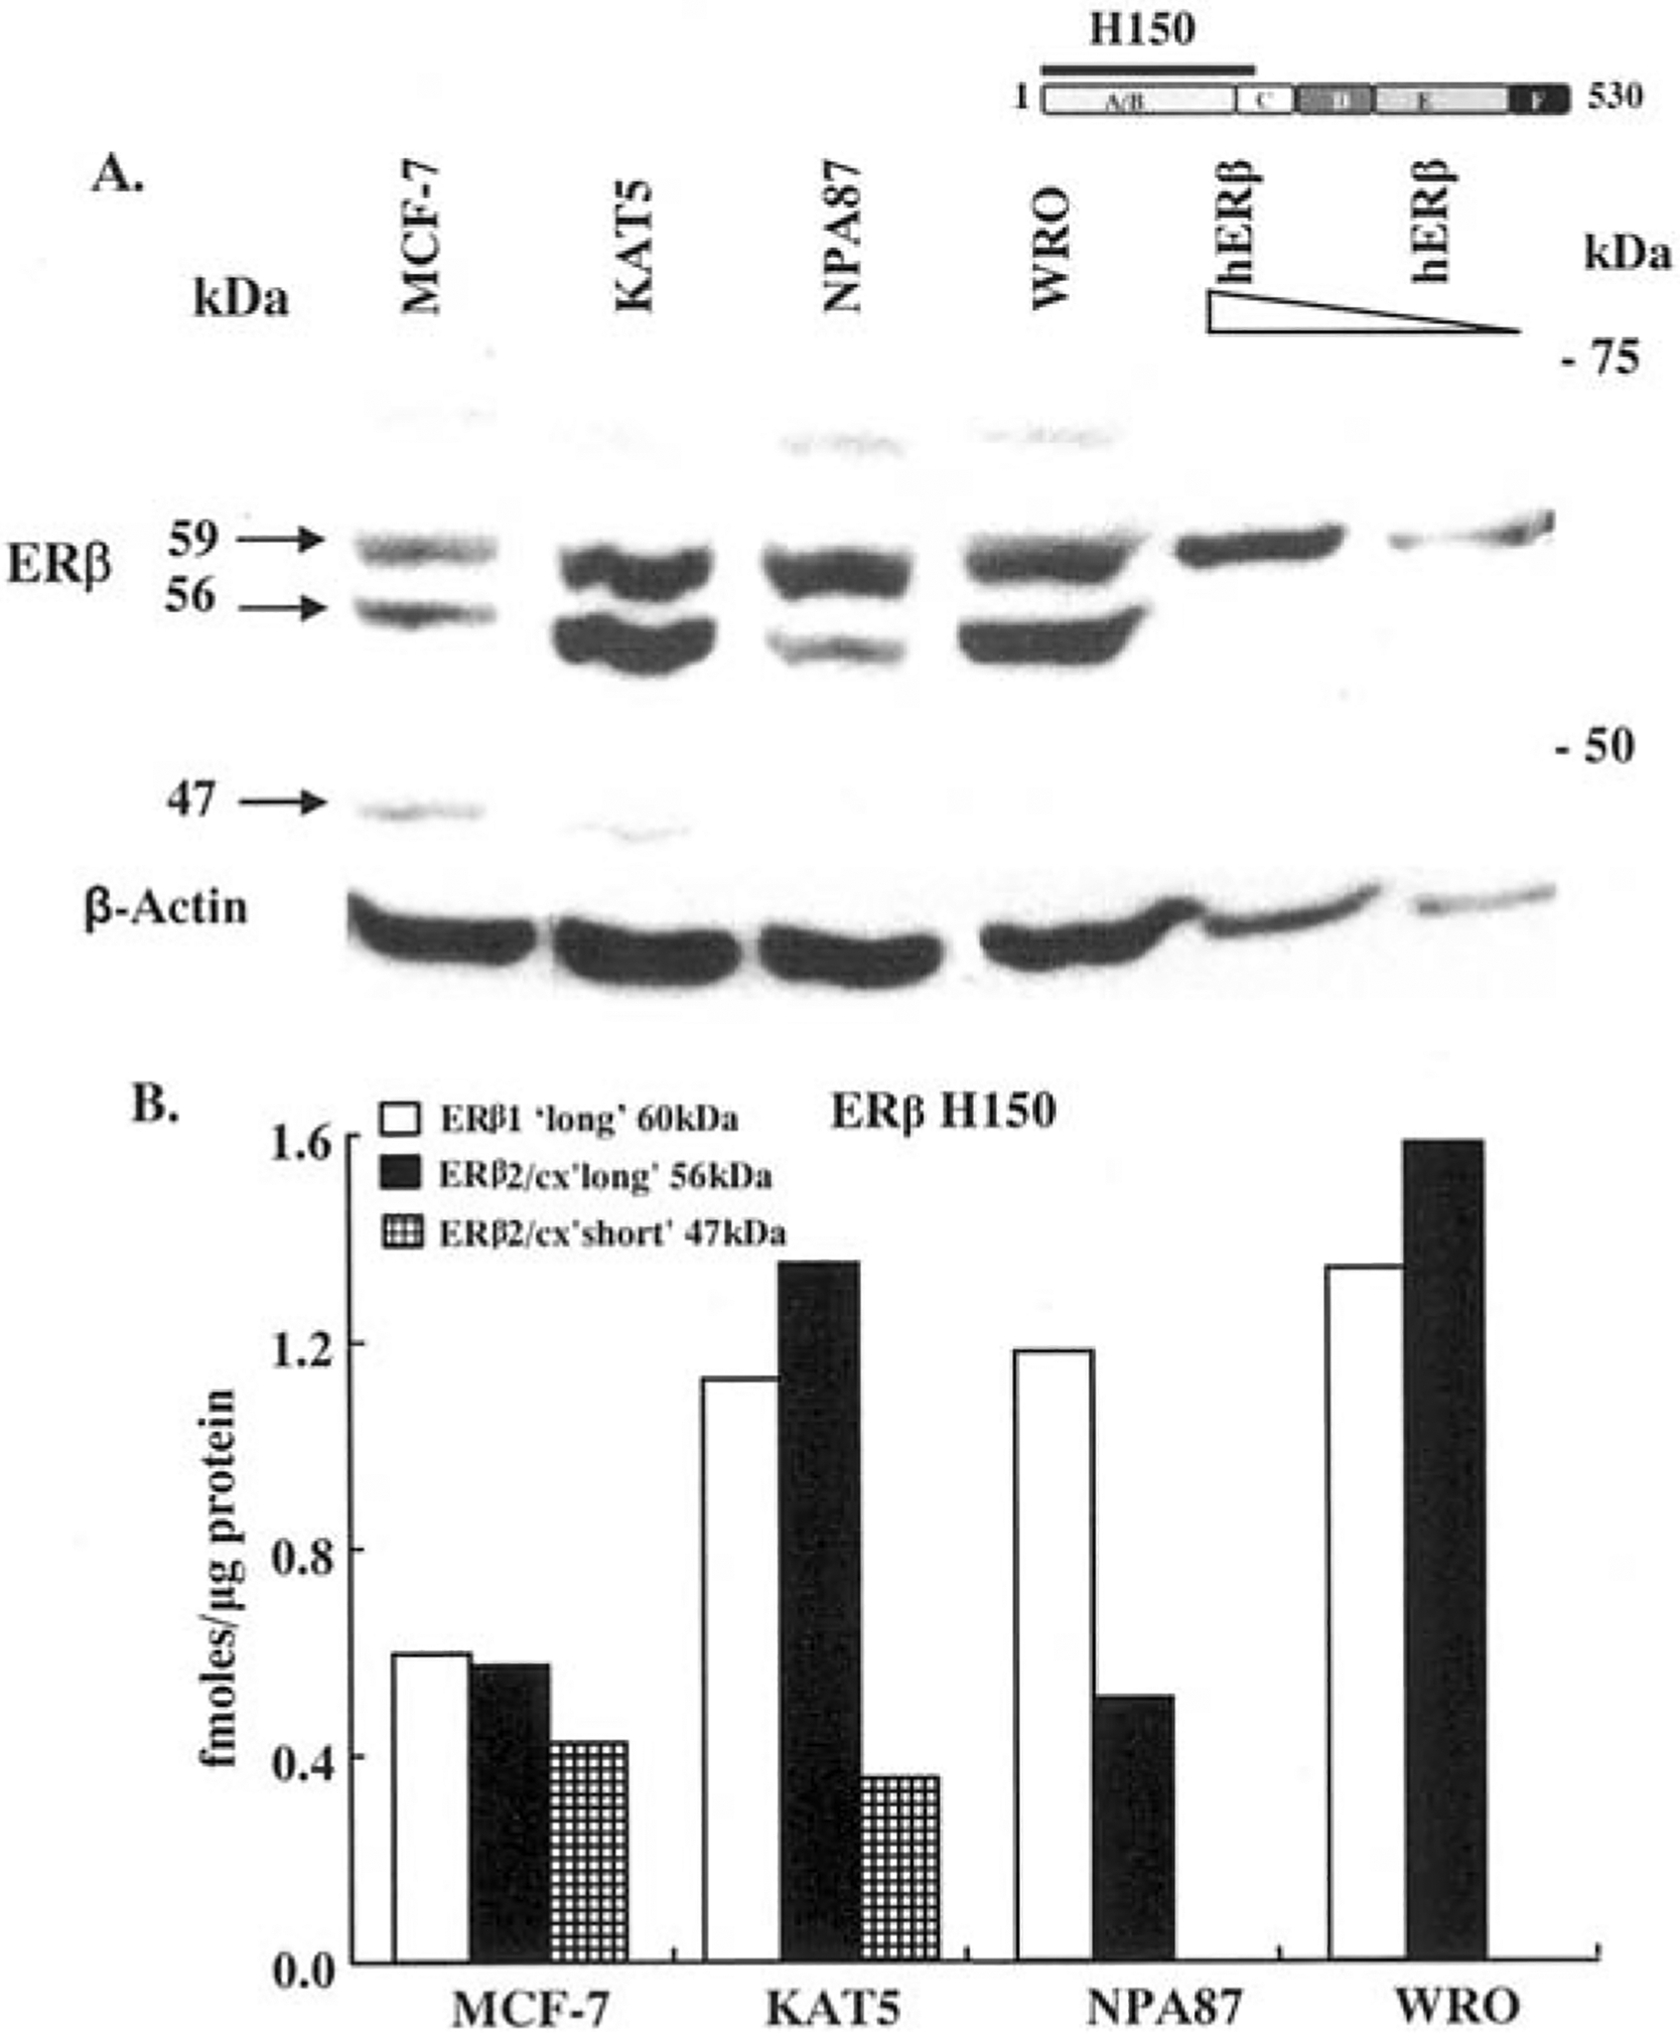
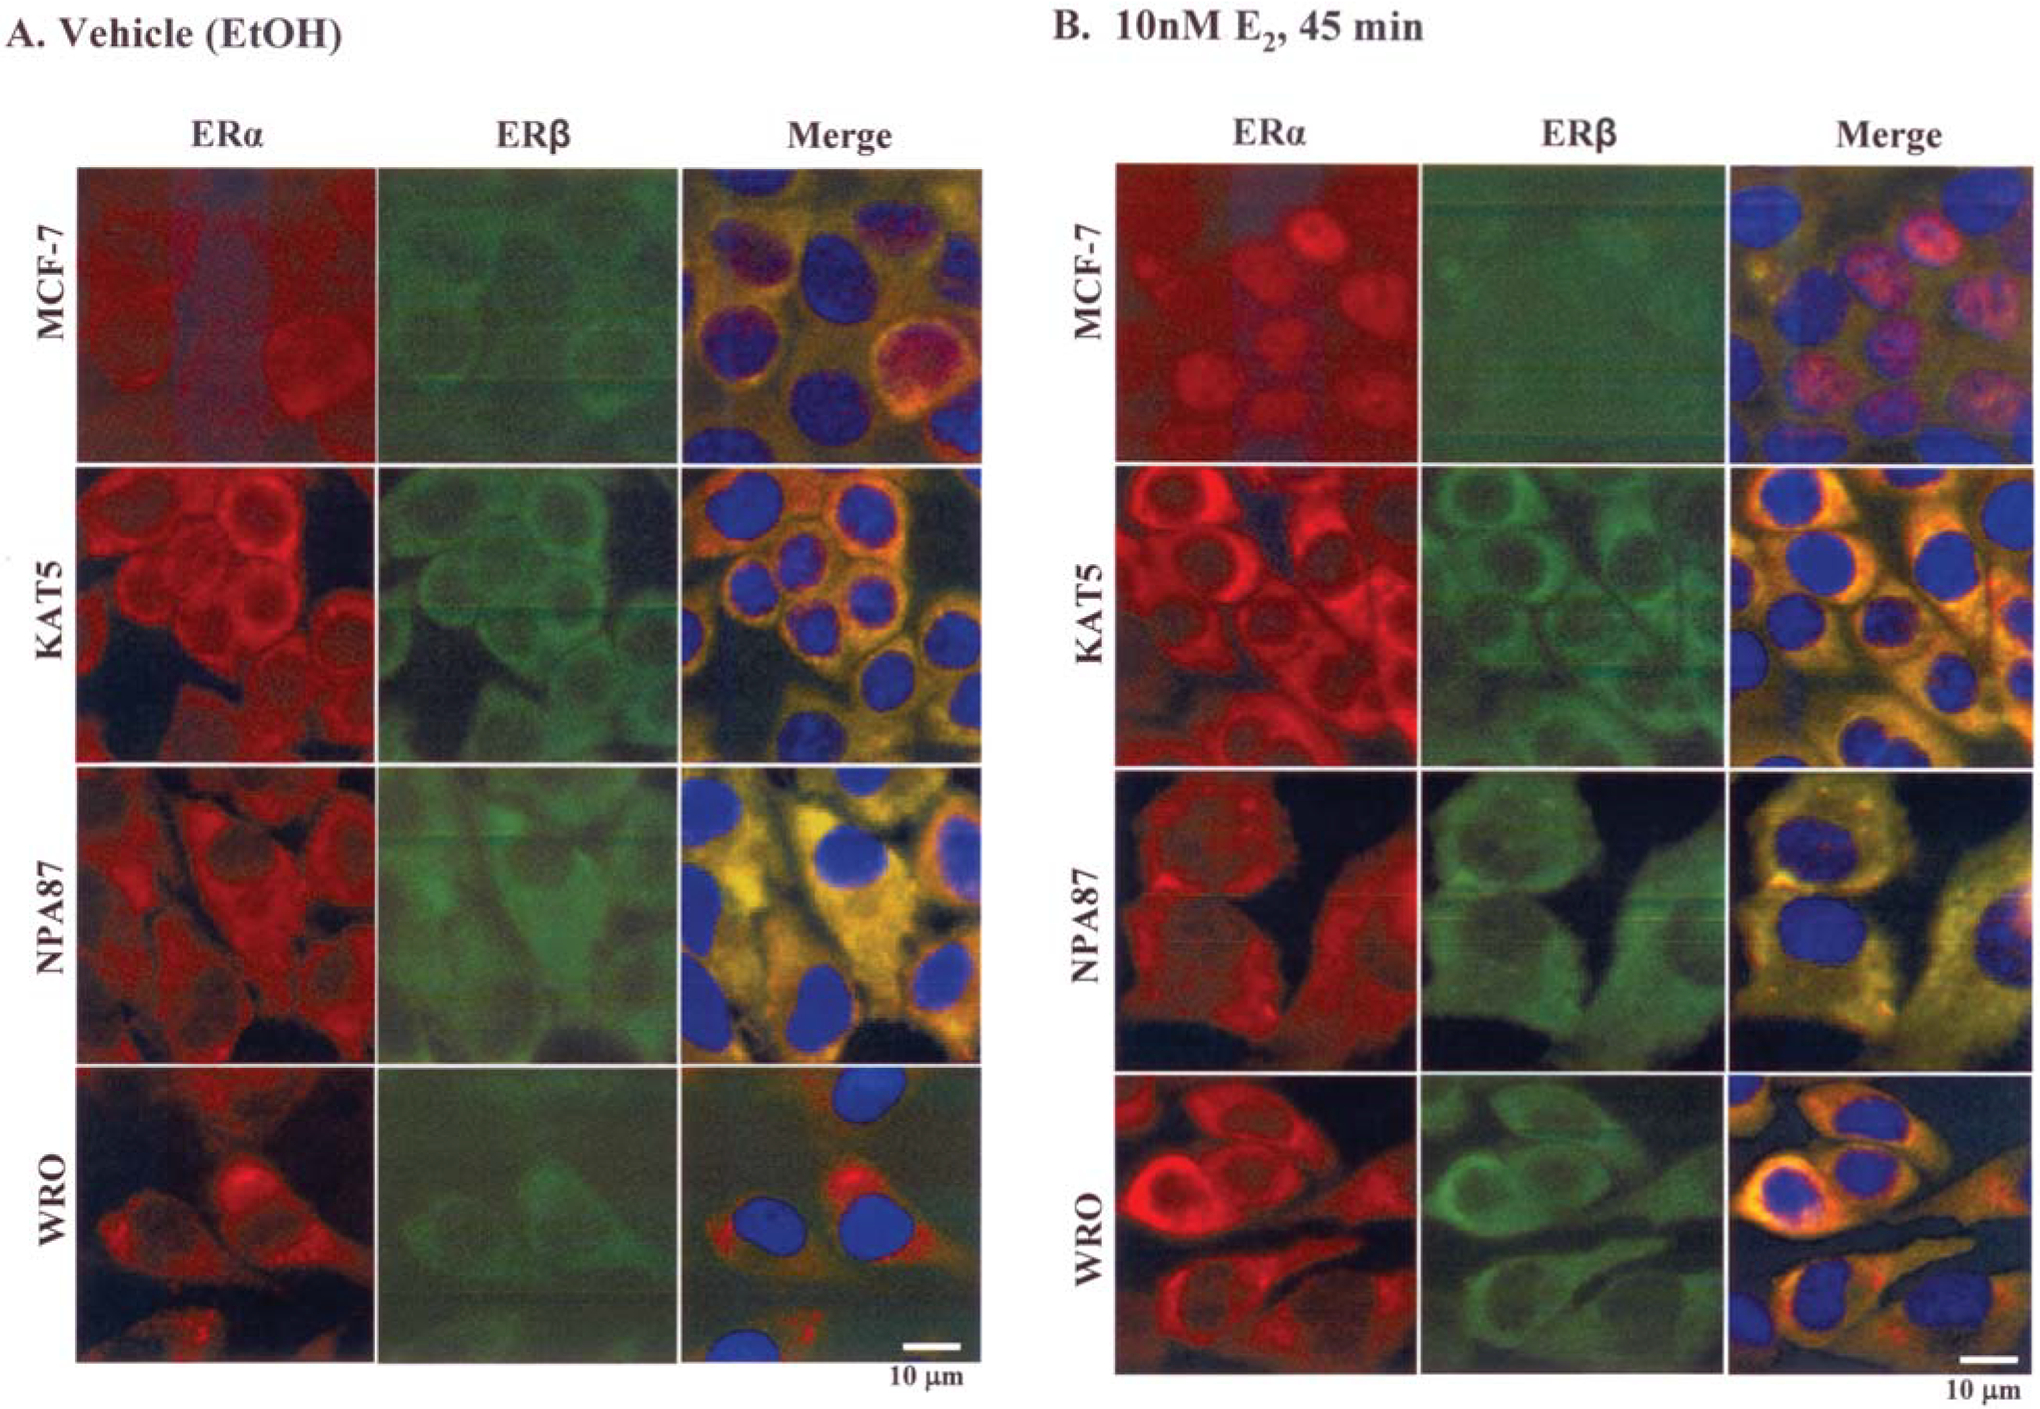
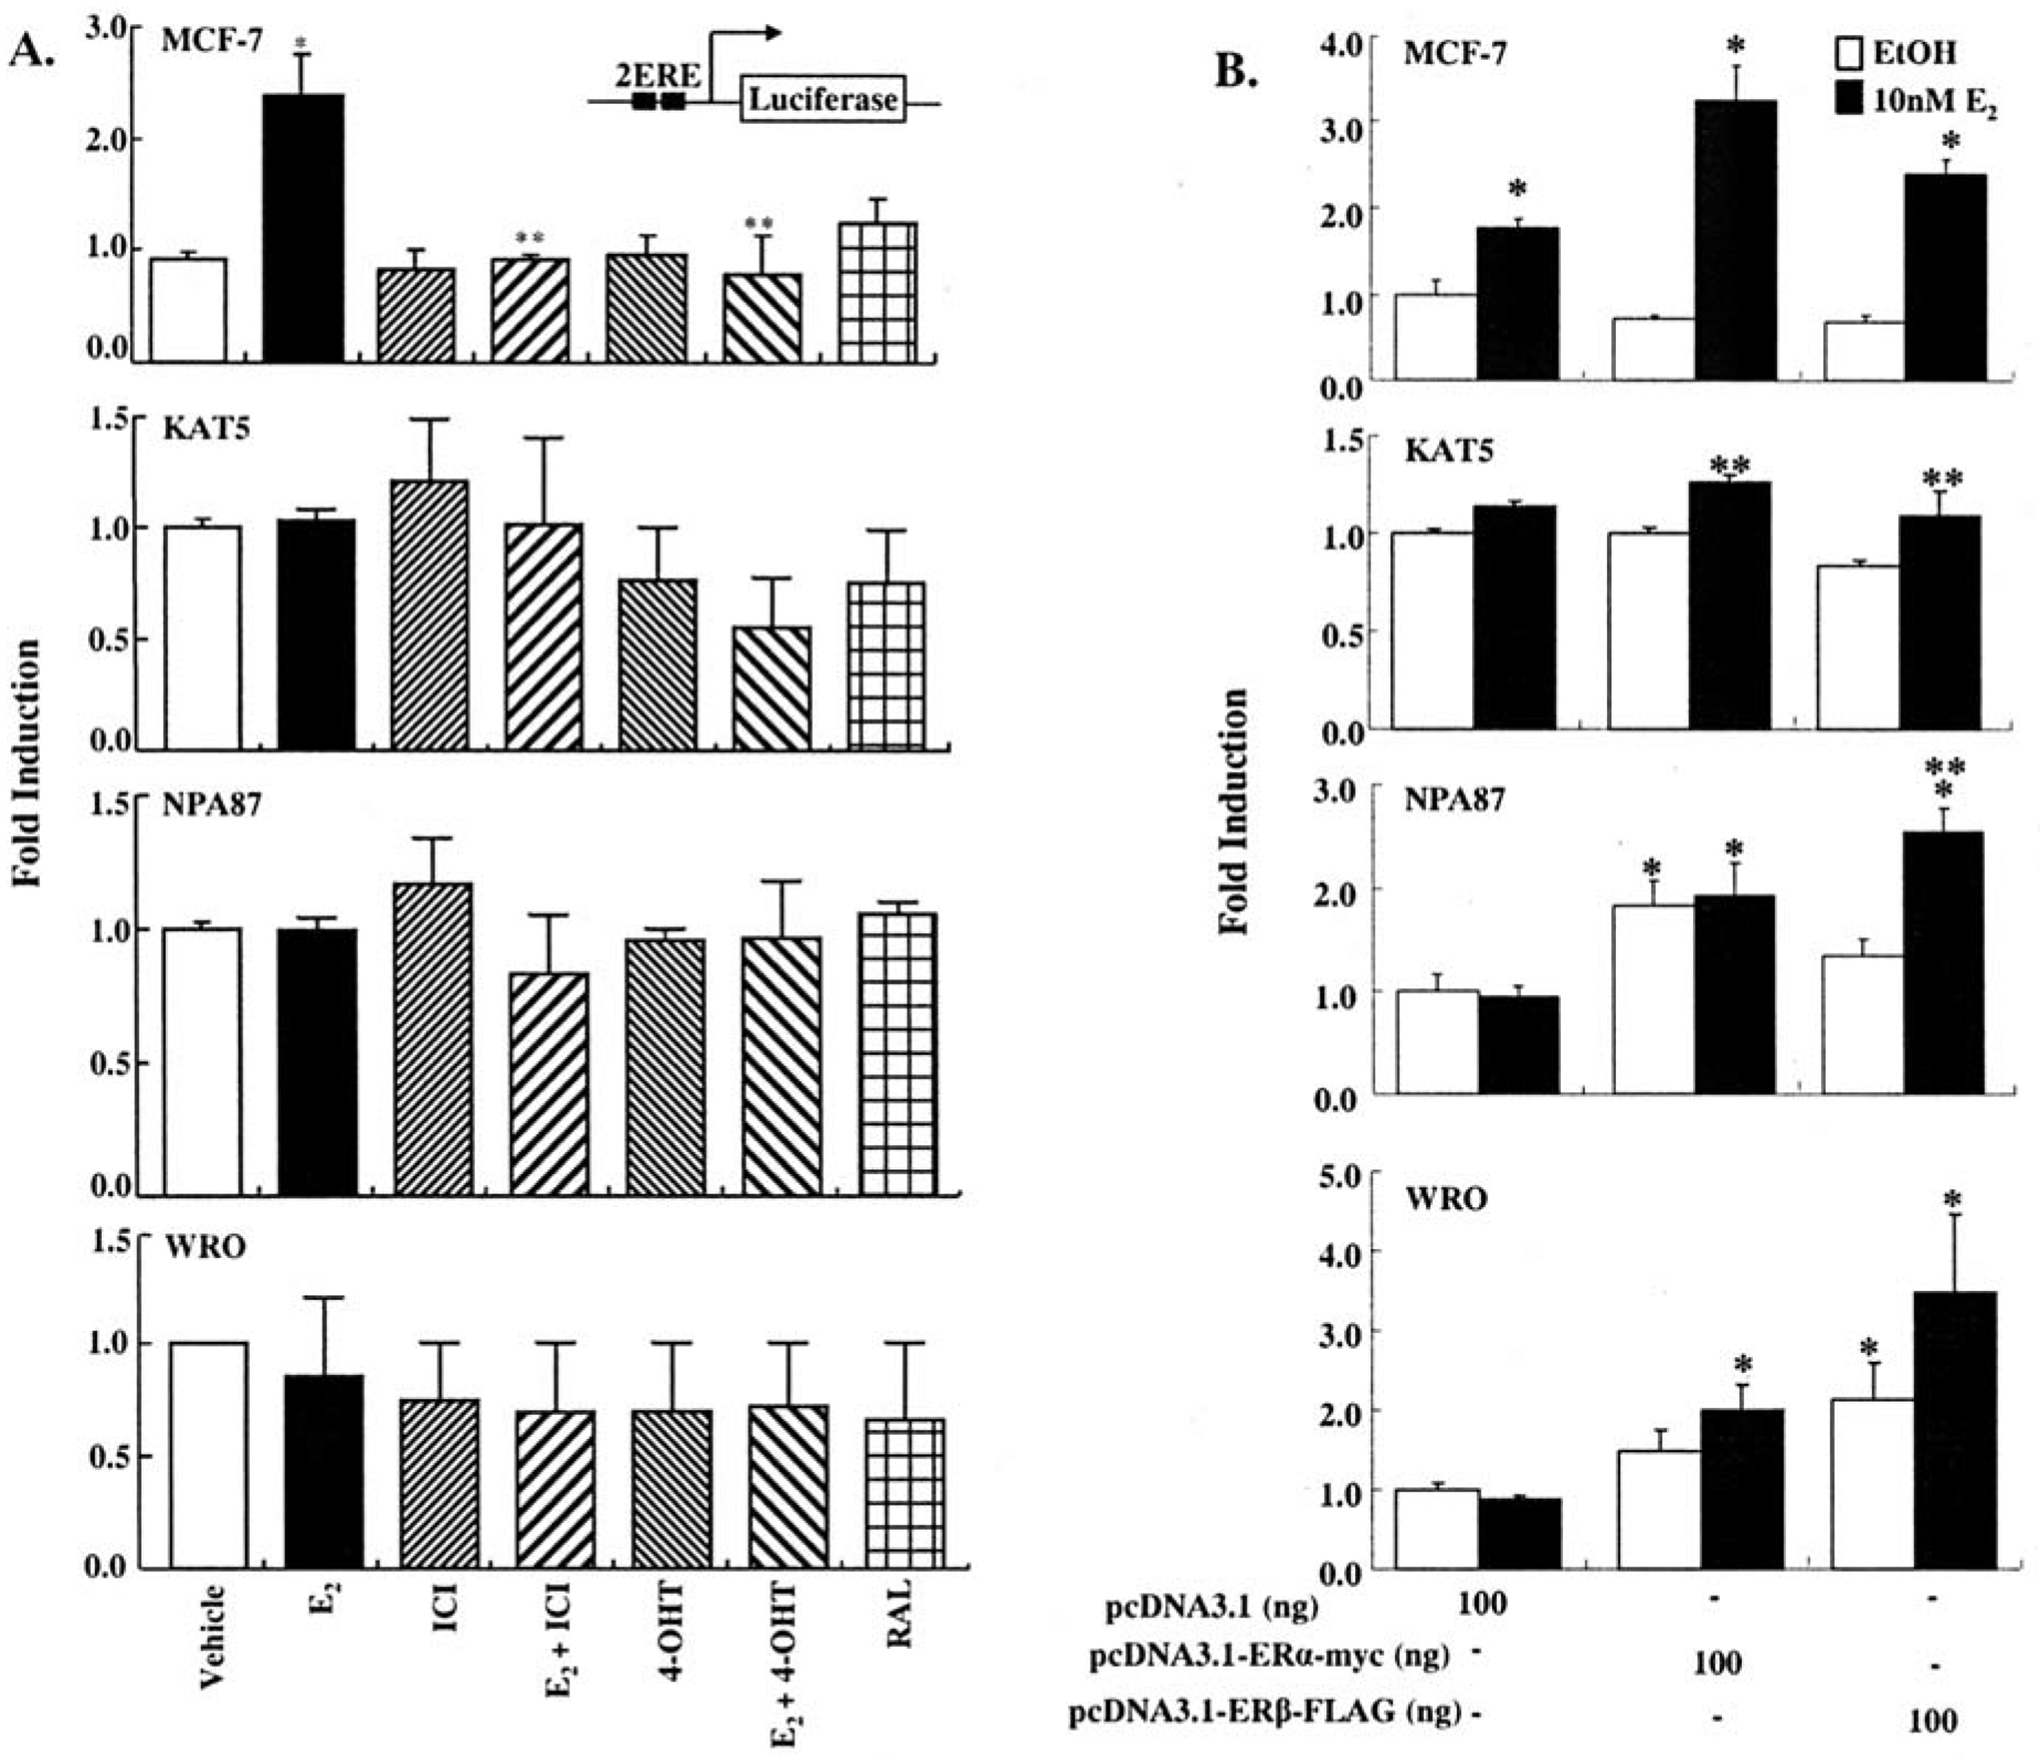
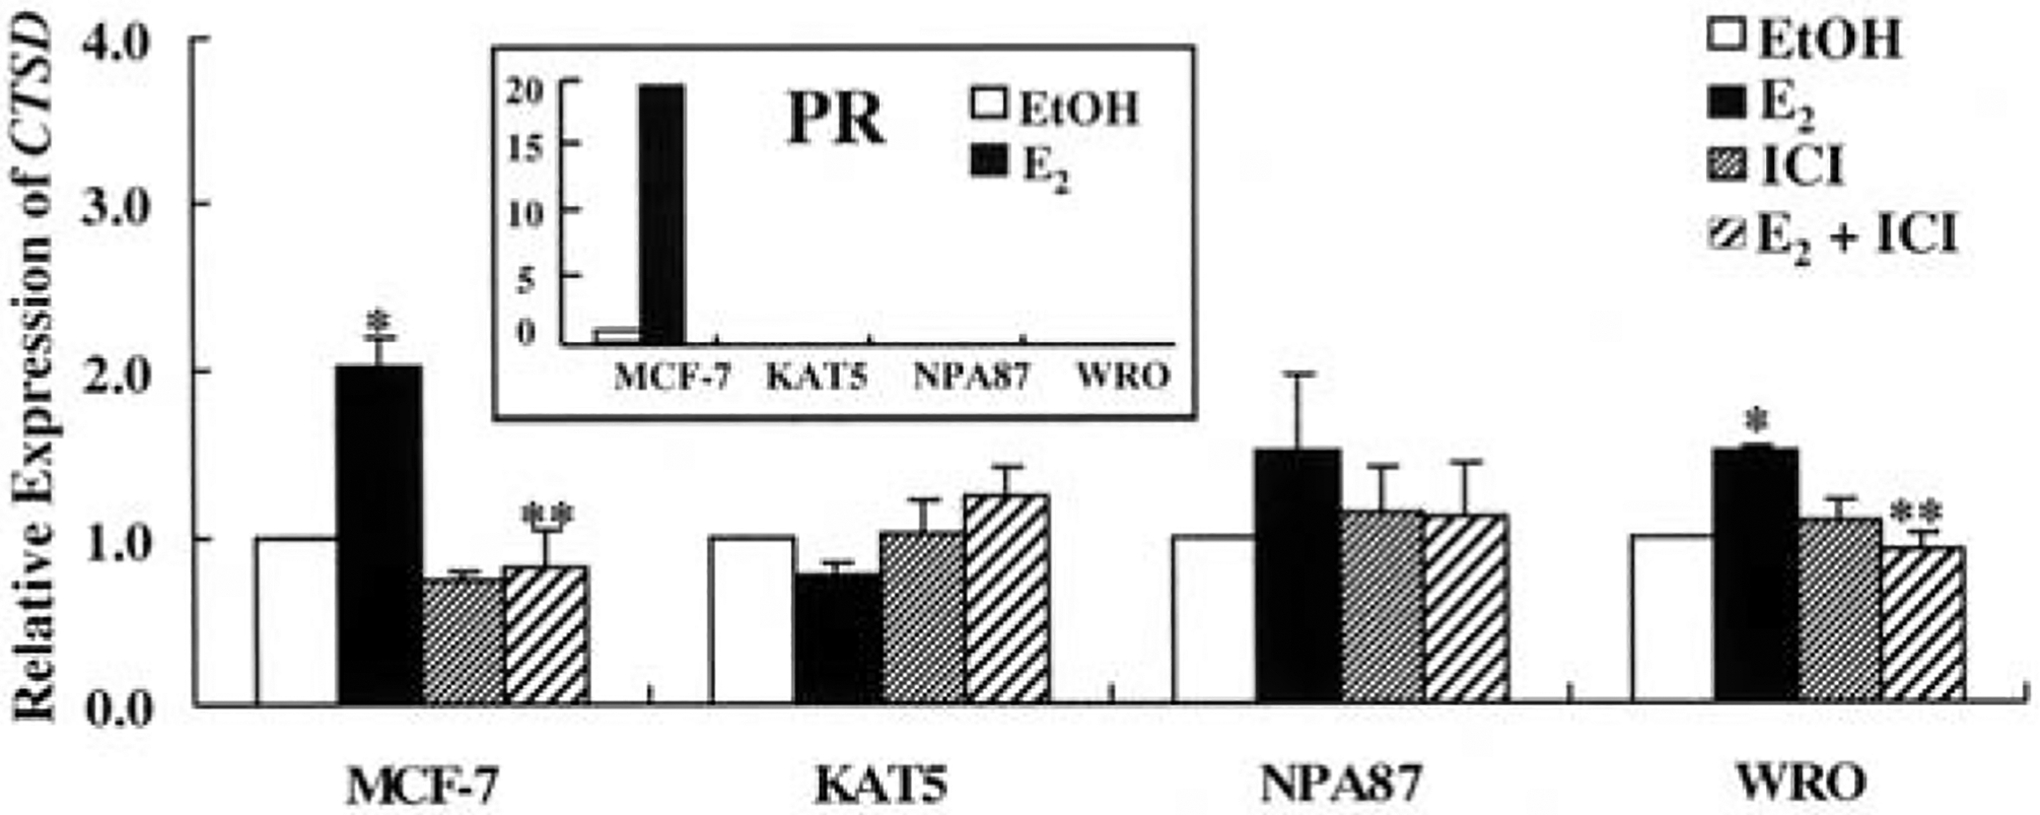
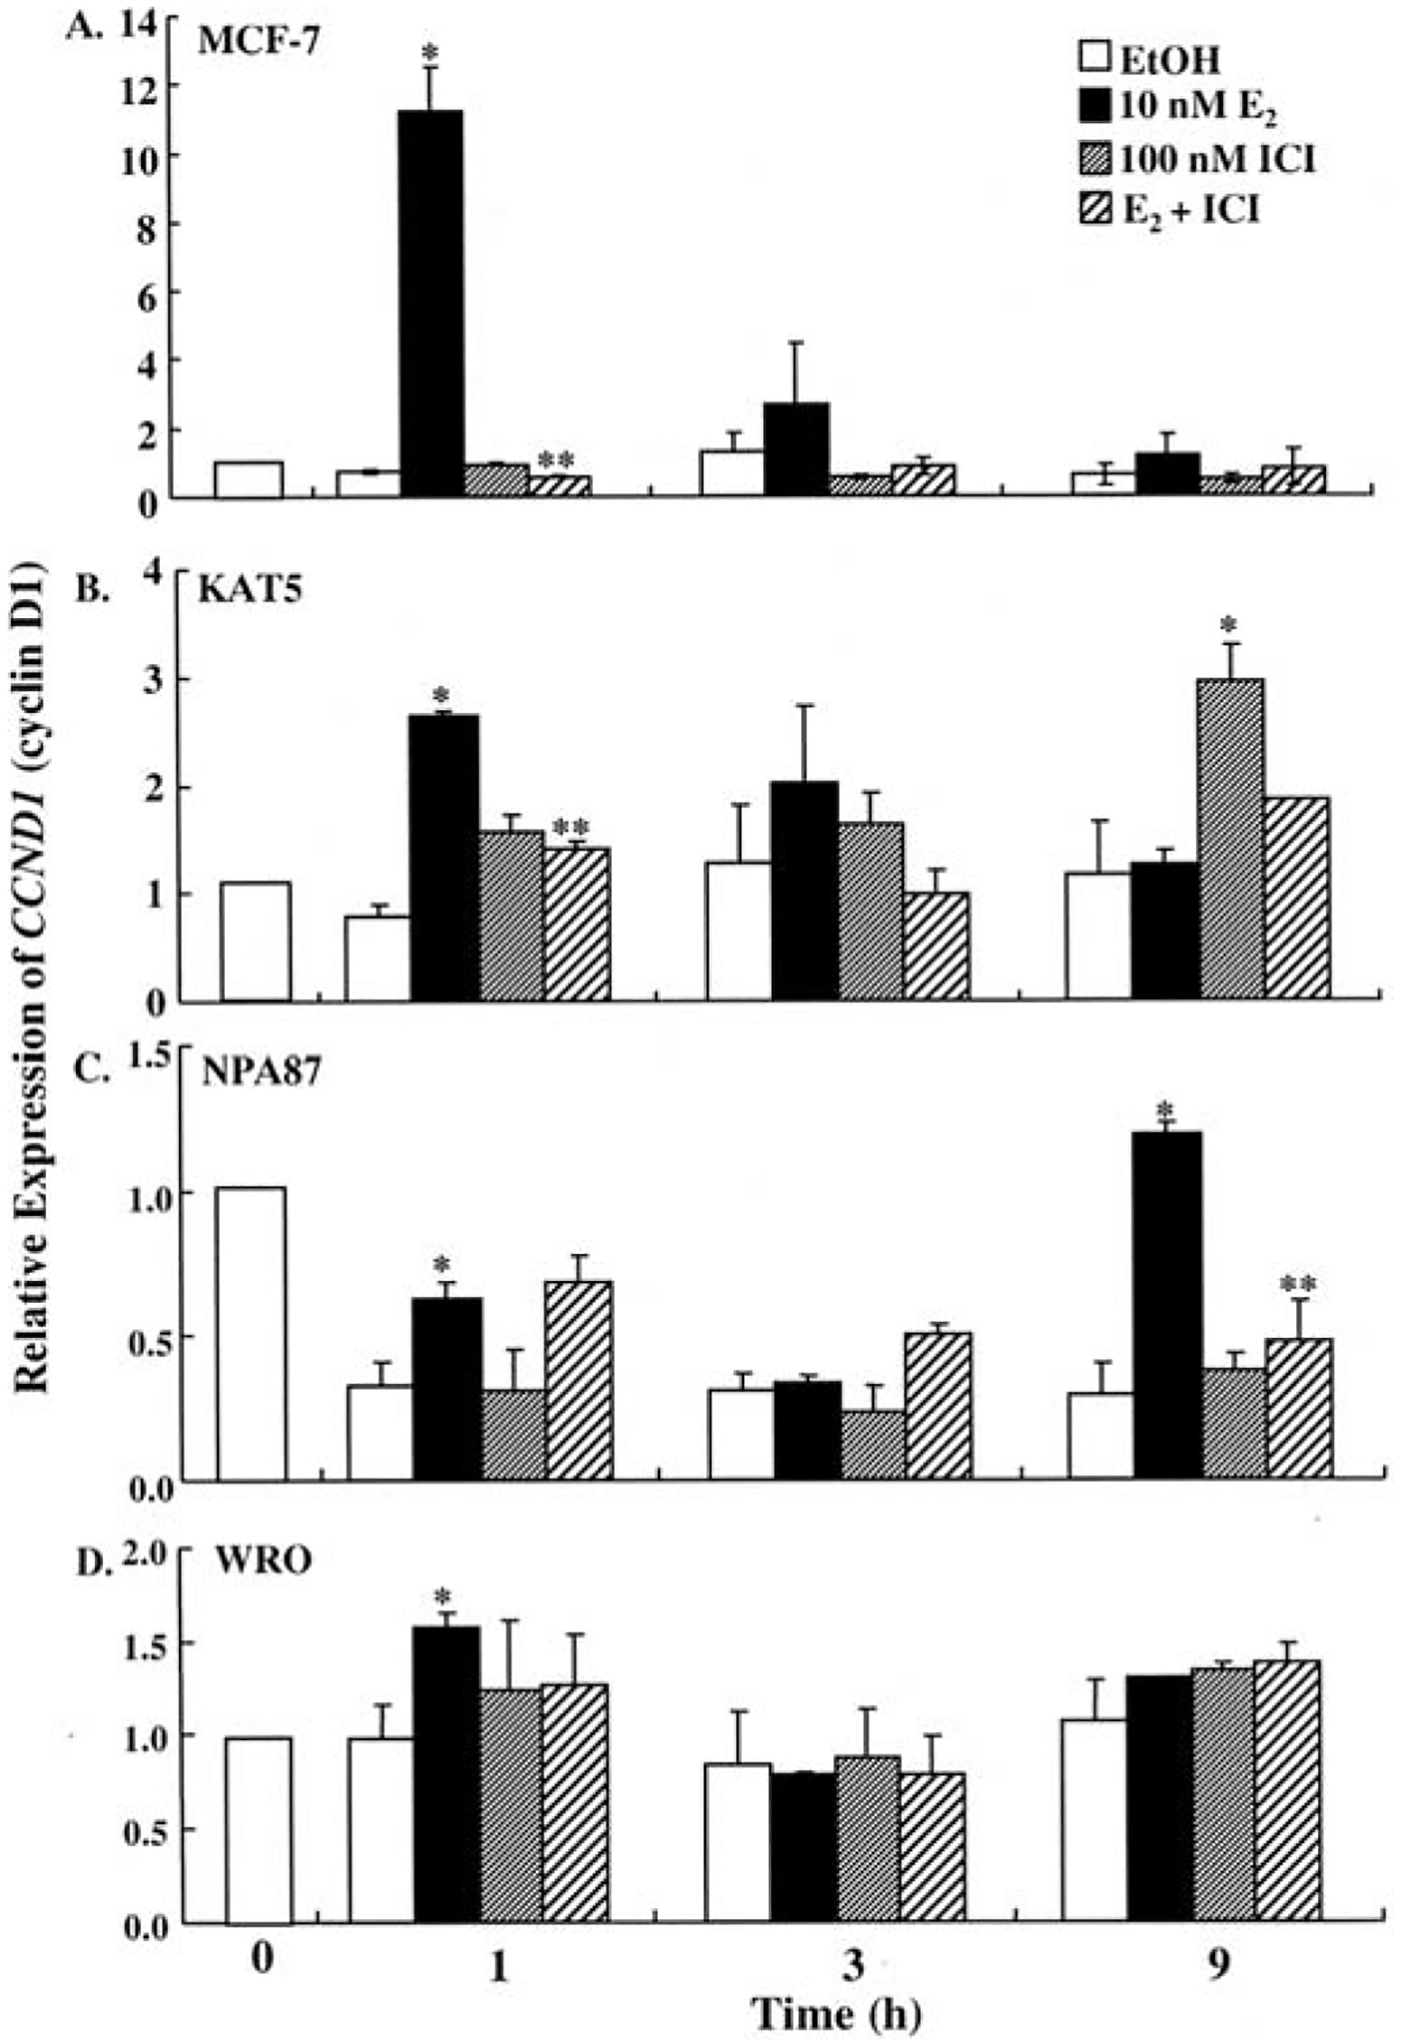
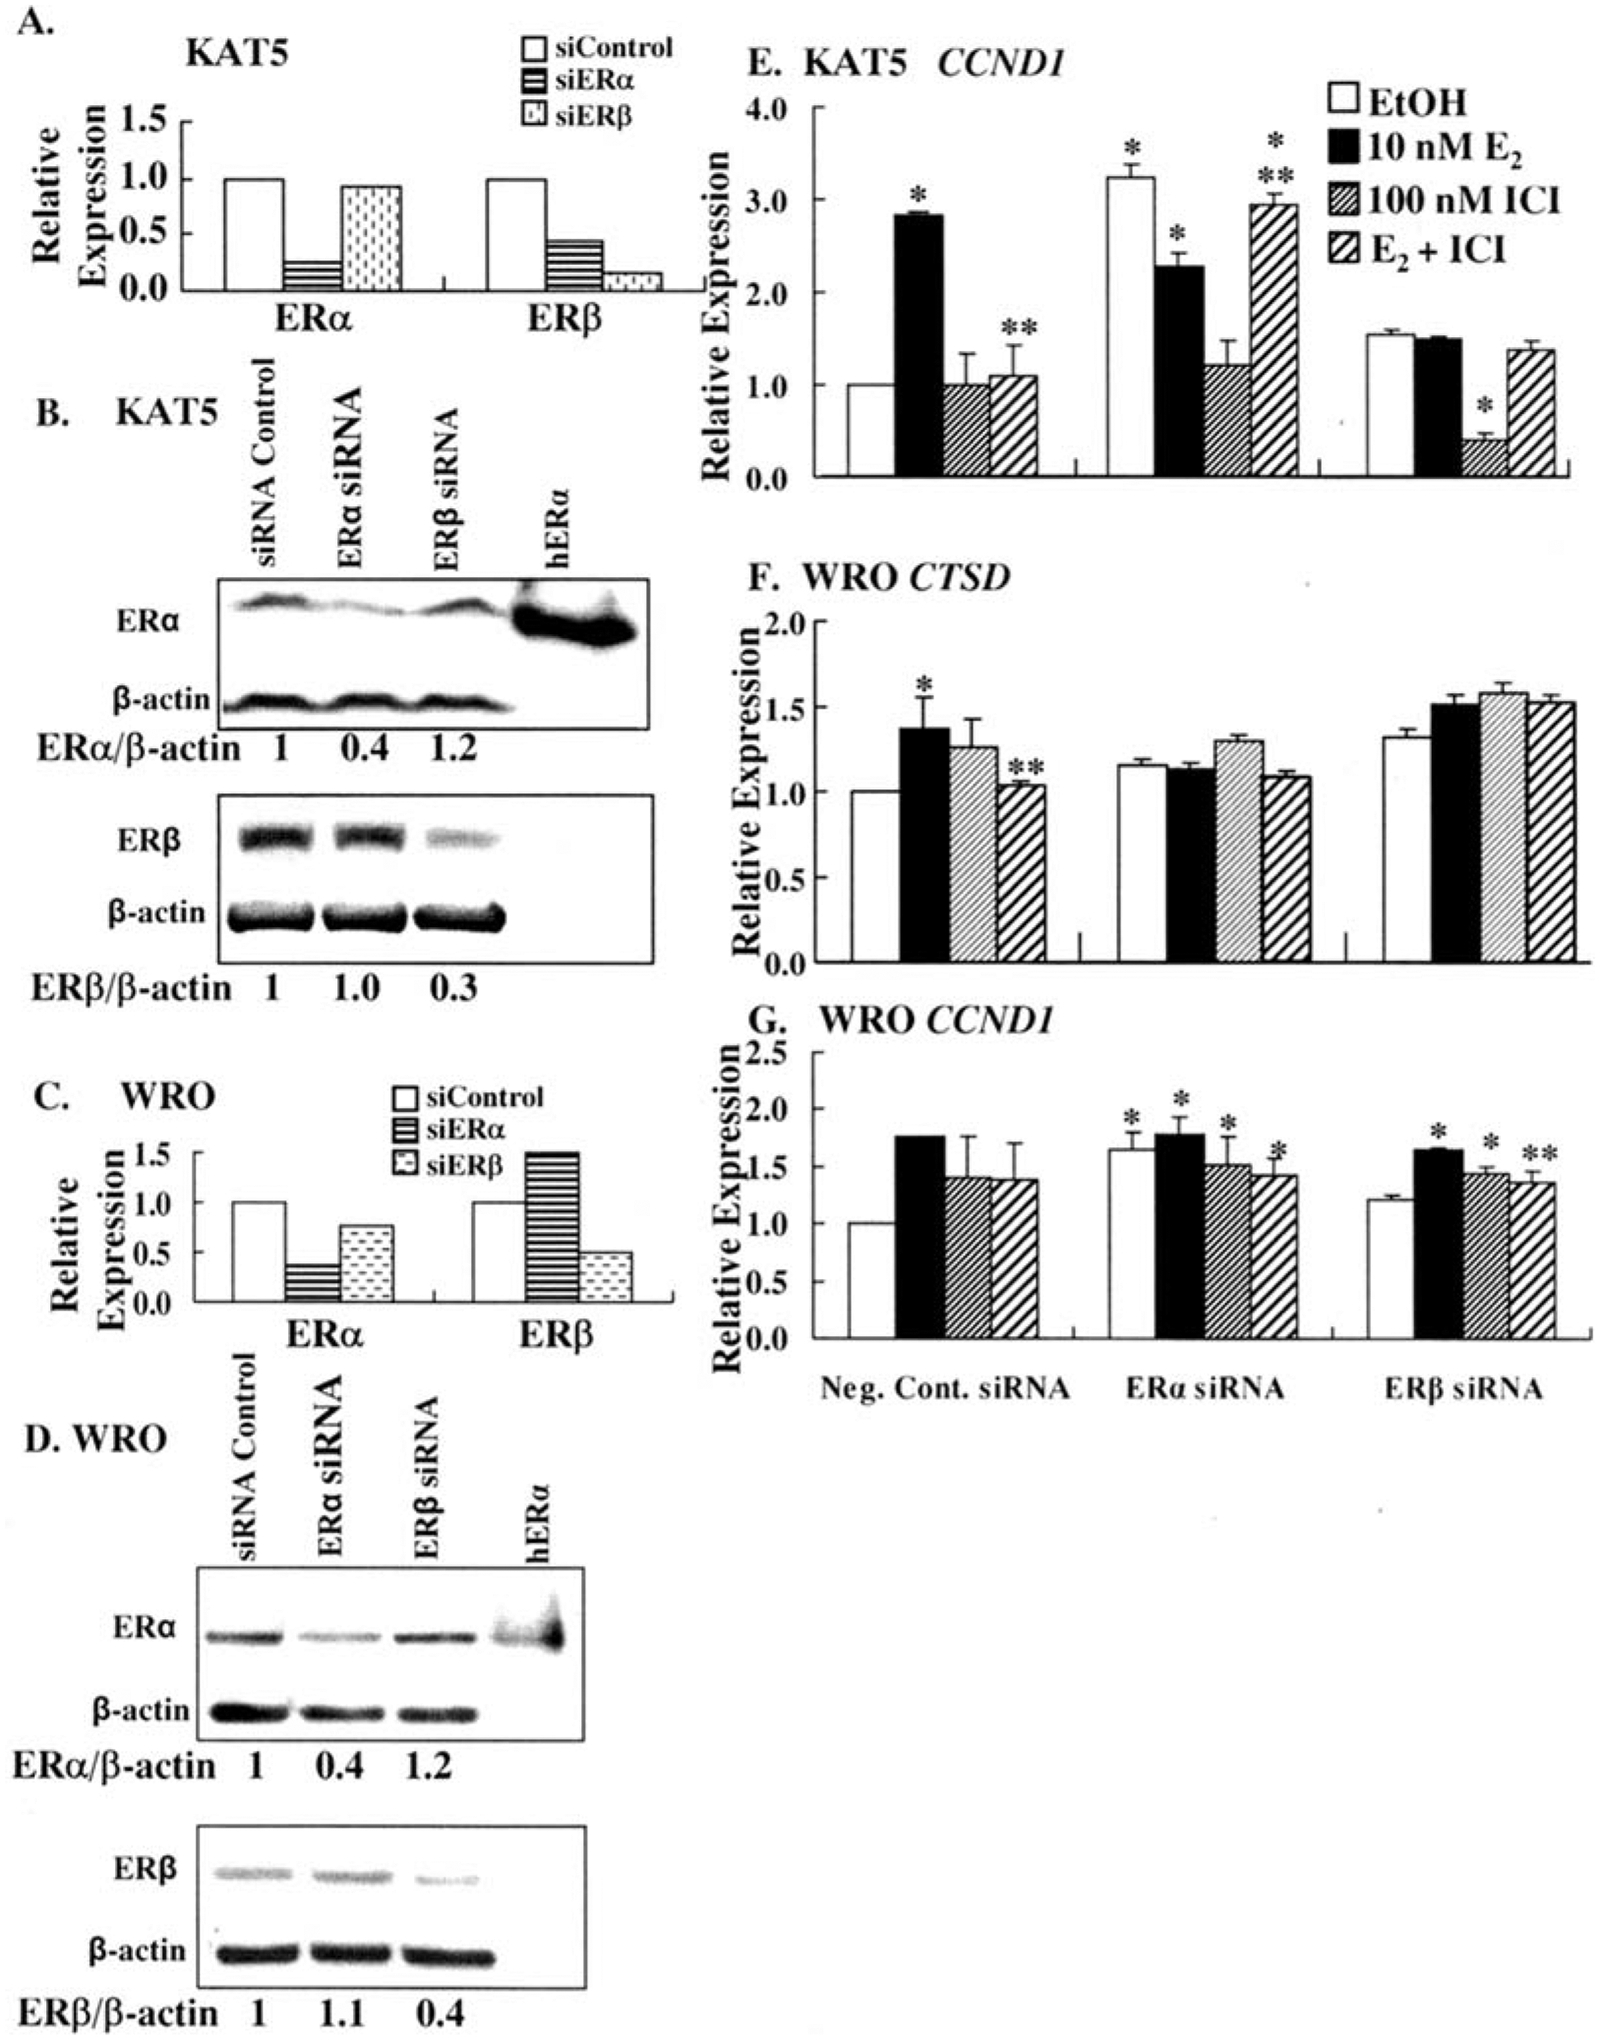
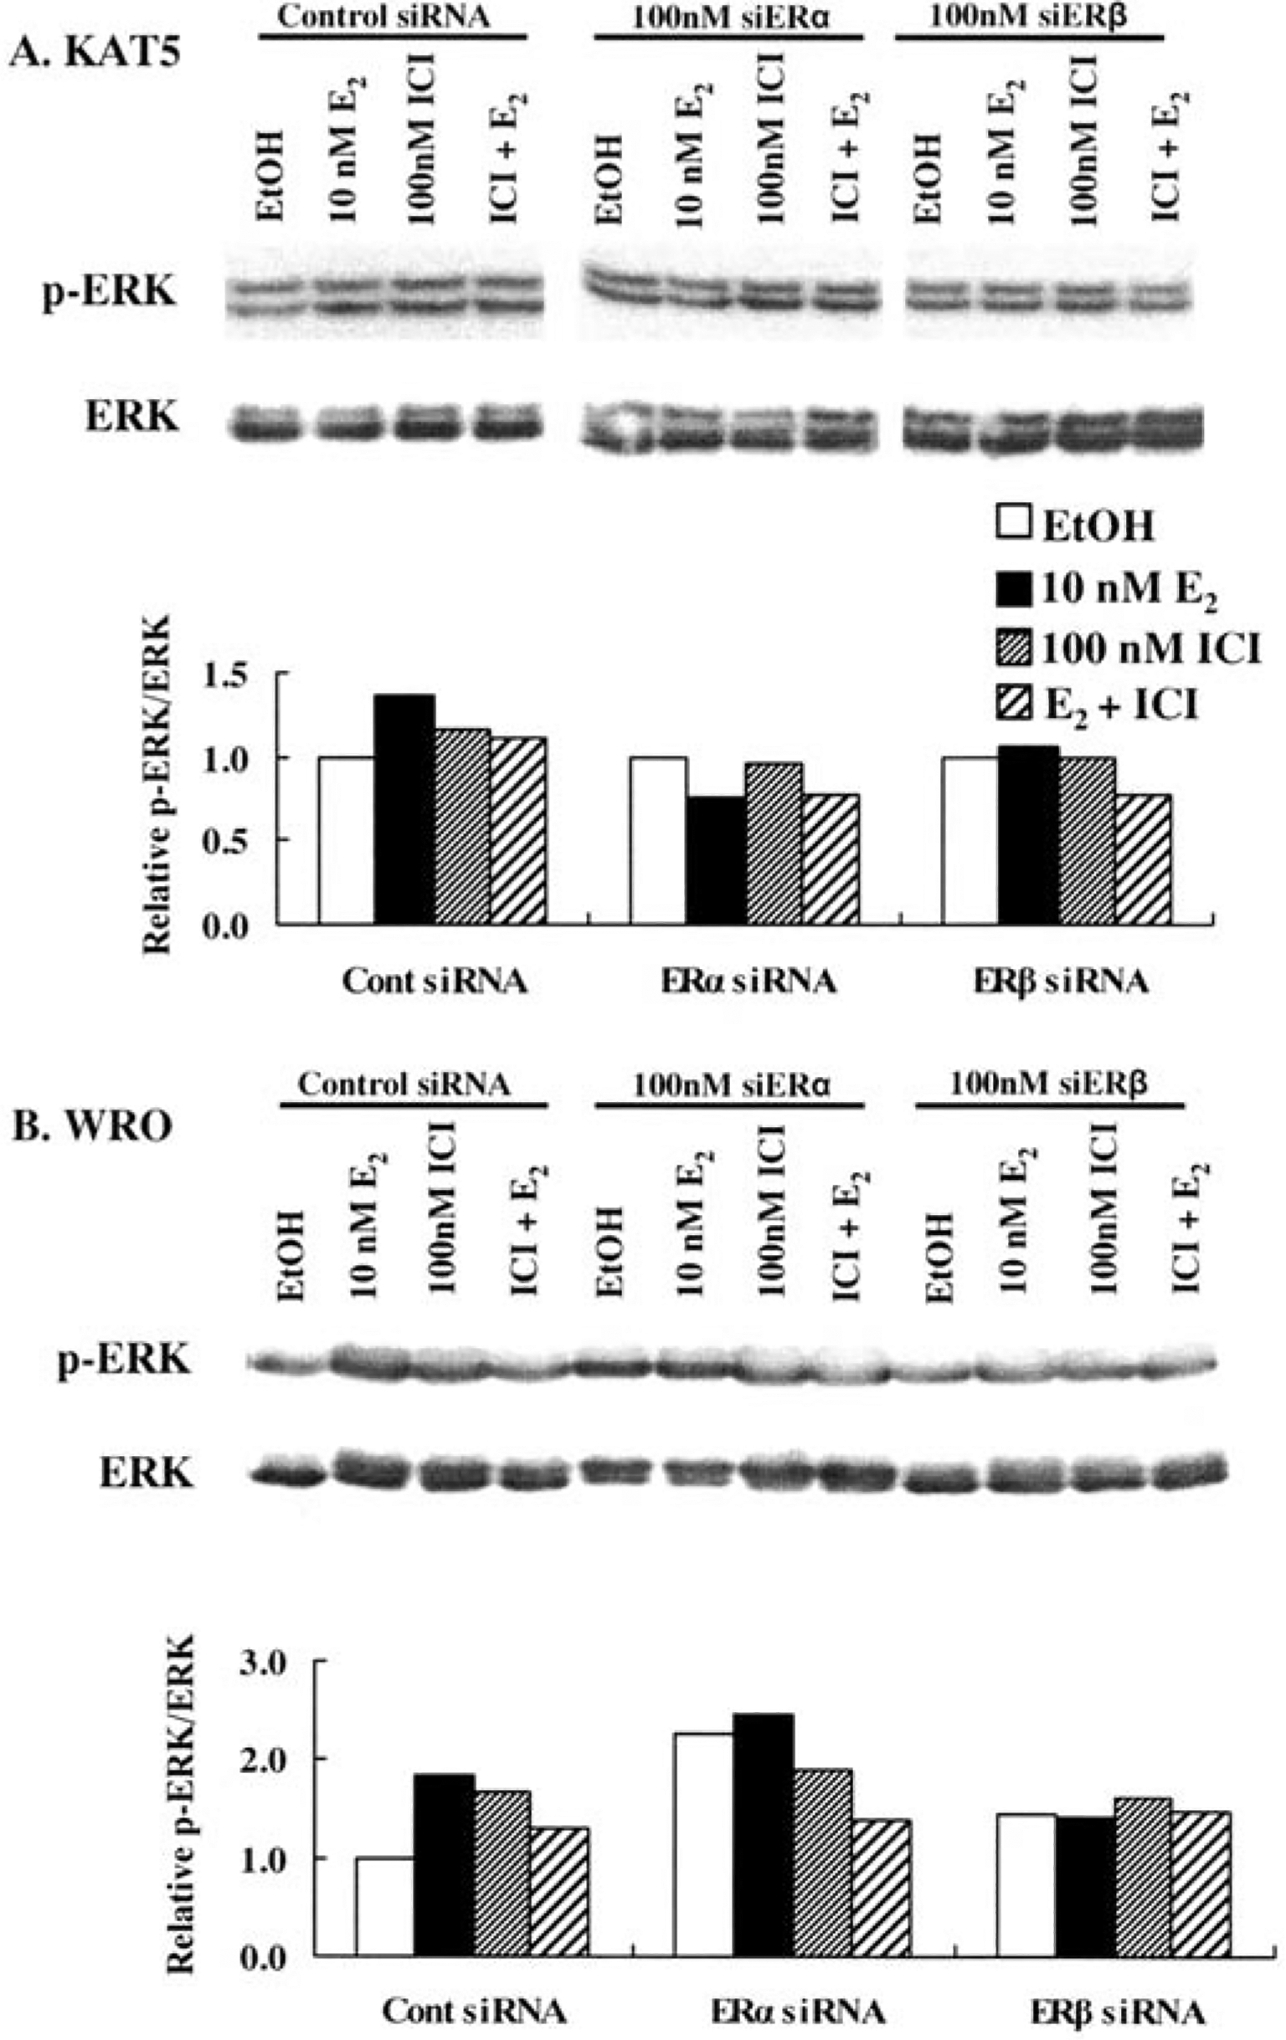
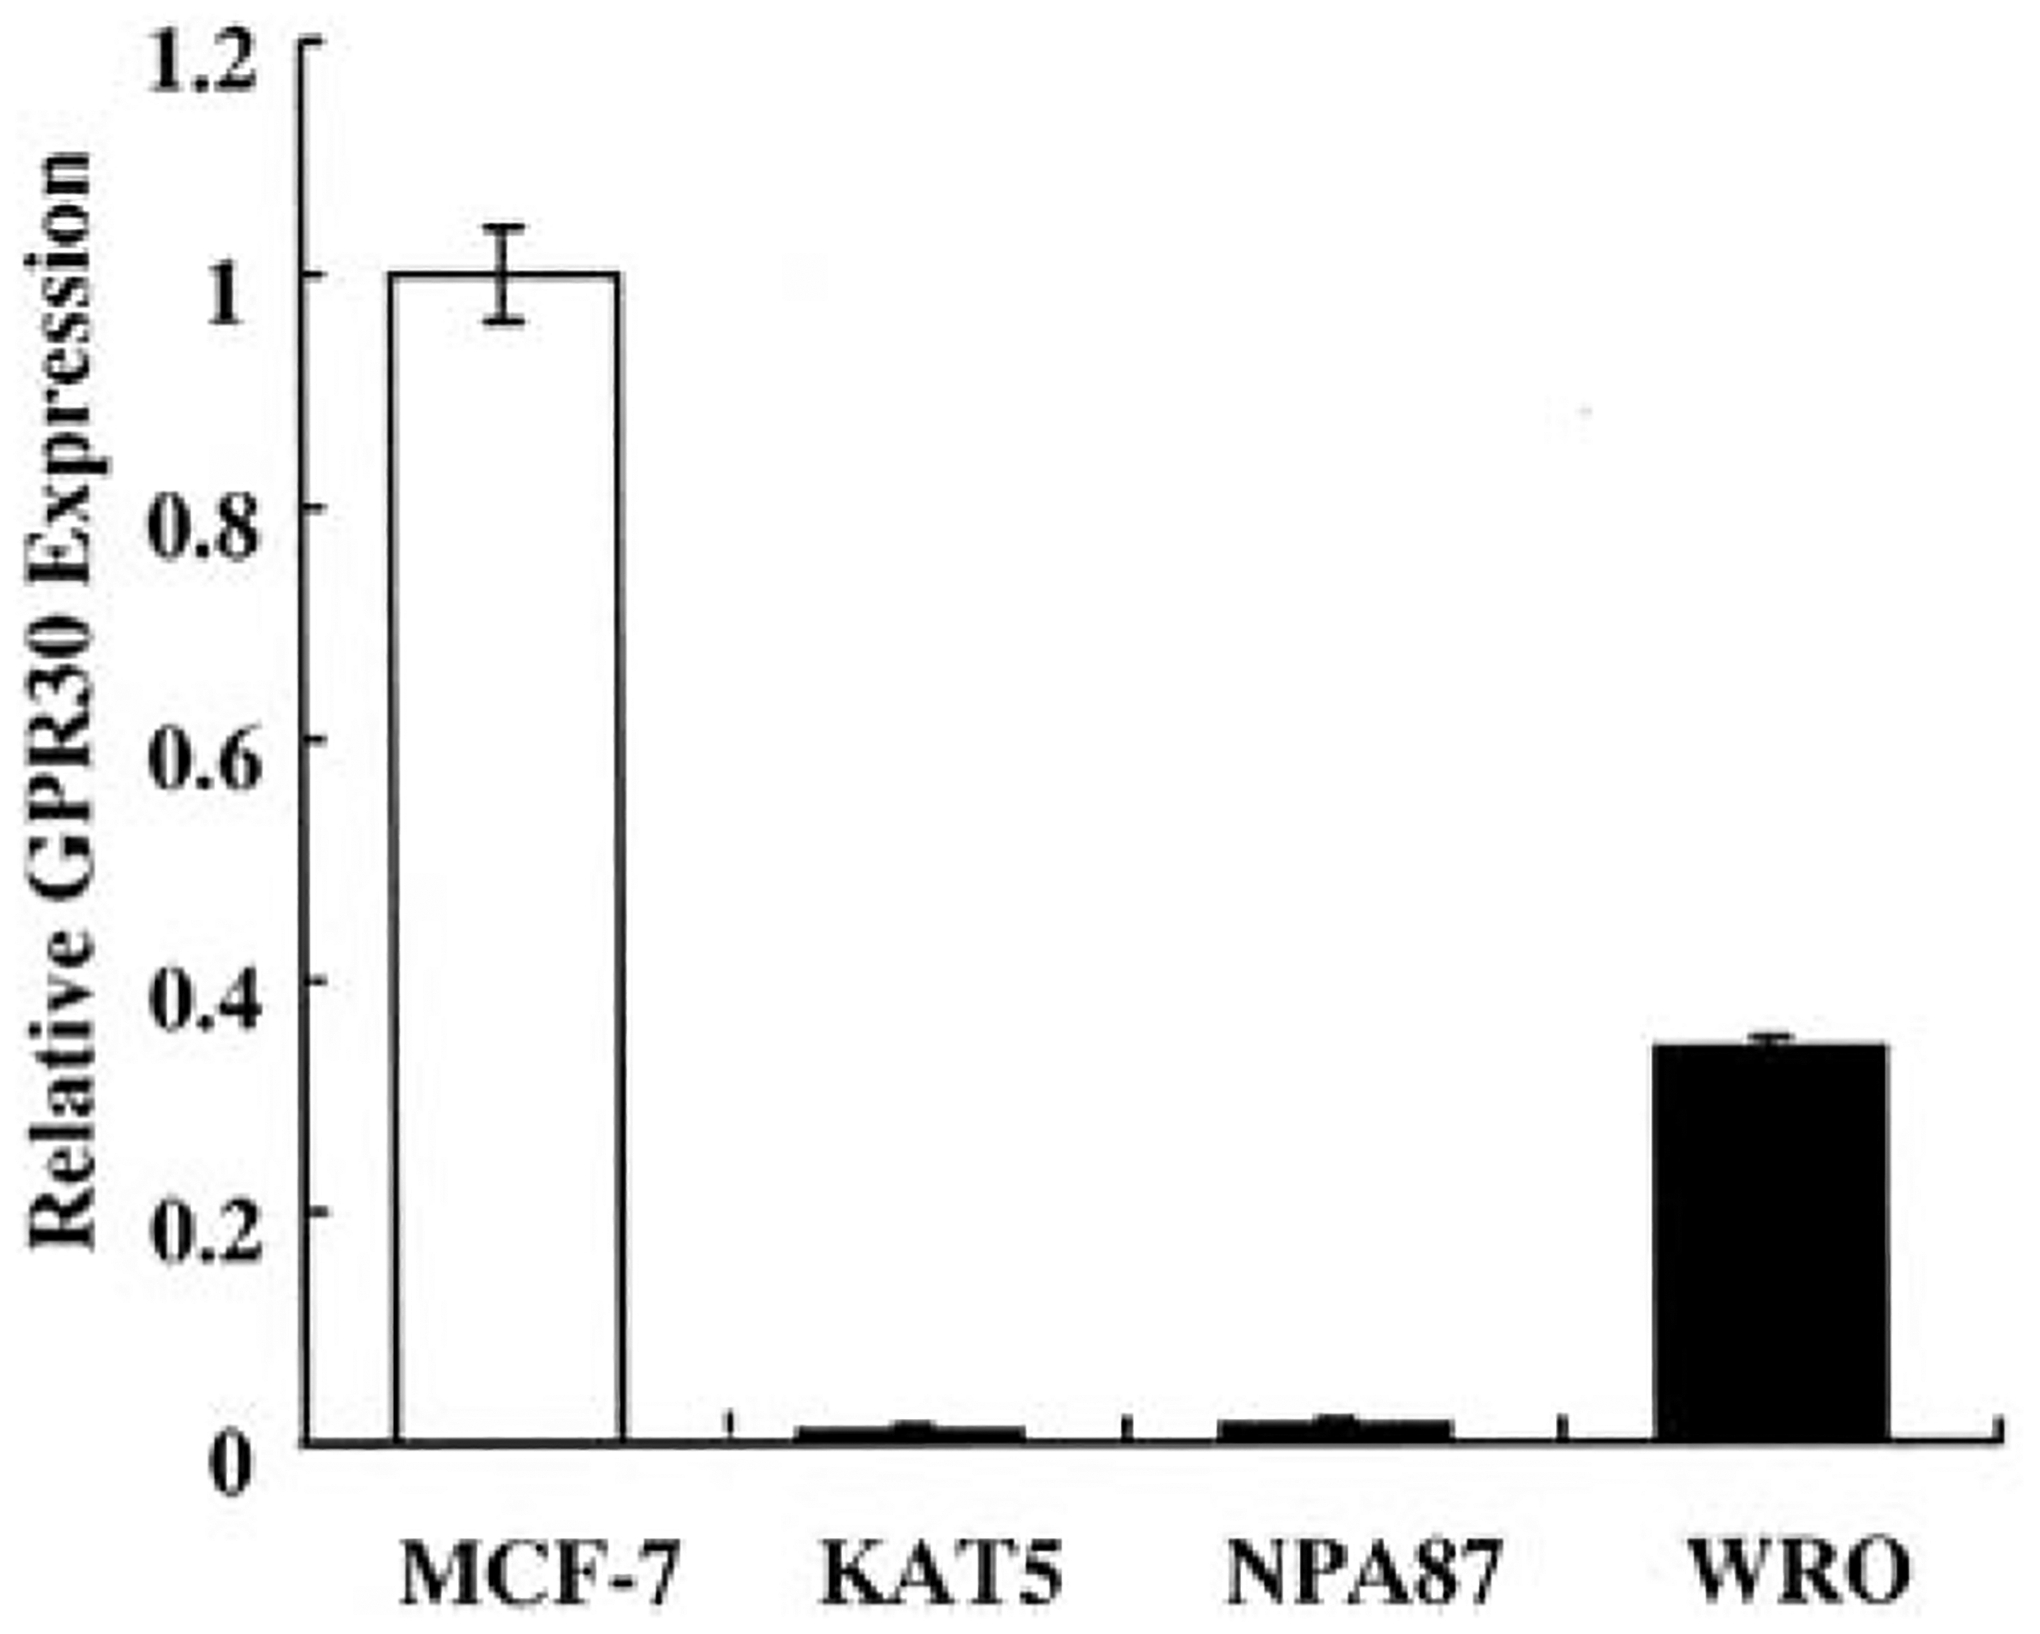
Premenopausal women are at highest risk for papillary and follicular thyroid carcinoma, implicating a role for estrogens in thyroid cancer. The expression of estrogen receptors alpha and beta (ER), the effects of estradiol (E2), selective estrogen receptor modulators (SERMs) 4-hydroxytamoxifen and raloxifene, and ER subtype selective agonists were examined in NPA87 and KAT5 papillary and WRO follicular thyroid carcinoma cell lines. All three thyroid cancer cell lines expressed full-length ERalpha and ERbeta proteins with cytoplasmic localization that was unaffected by E2. ICI 182,780 (Fulvestrant, an ER antagonist), and inhibitors of non-genomic E2-activated MAPK and PI3K signaling blocked E2-induced cell proliferation. SERMs acted in a cell line-specific manner. No E2-induced estrogen response element (ERE)-driven reporter activity was observed in transiently transfected thyroid cancer cells. However, E2 increased transcription of established endogenous E2-target genes, i.e., cathepsin D in WRO and cyclin D1 in both KAT5 and WRO cells in an ER-dependent manner as validated by inhibitor and siRNA experiments. In contrast, E2 did not increase progesterone receptor expression in the thyroid cancer cell lines. E2 stimulated phosphorylation of ERK1/2 in KAT5 and WRO cells and siERalpha or siERbeta inhibited E2-induced ERK phosphorylation. Expression of the putative membrane estrogen receptor GPR30 was detected in WRO, but not NPA87 or KAT5 cells. GPR30 expression was lower in WRO than MCF-7 human breast cancer cells. Overall, these findings suggest E2-mediated thyroid cancer cell proliferation involves ERalpha and ERbeta transcriptional and non-genomic signaling events.


Figures

Figure 1.
Figure 1.
E2 increases thyroid cancer cell proliferation. The effect of the indicated concentrations of E2 and 100 nM ICI, 100 nM 4-OHT, 100 Nm RAL, 10 nM DPN, 10 nM PPT, alone or in combination with 10 nM E2 on the proliferation of KAT5 (A), NPA87 (B), and WRO (C) thyroid cancer cells was determined after 48 h of treatment by assaying BrdU incorporation as described in Materials and methods. Where indicated, cells pre-incubated for 3 h with the non-genomic pathway inhibitors at the concentrations shown. Data were normalized to the vehicle (EtOH/DMSO) in each experiment. Values are % of vehicle control and are the mean ± SEM of at least 5 independent experiments. *Significantly different from vehicle (EtOH) or **10 nM E2 within each cell line, respectively (p<0.05).
Figure 2.
Figure 2.
Thyroid cancer cells express ERα. The expression of ERα was examined by Western blotting using 50 μg of WCE protein from the indicated cell lines using ERα monoclonal AER320 (A) or polyclonal HC-20 (C) antibodies as described in Materials and methods. The indicated fmoles of recombinant human (rh) ERα were included as a control. The membrane was stripped and reprobed for ß-actin. The epitopes recognized by each ERα antibody are indicated by the black bar above the E-F domains in the ERα diagram provided at the top right (A and C). The migration of molecular weight (MW) standards is indicated at the right (kDa). The MW sizes of the immunoreactive ERα bands, indicated at the left, were estimated as described in Materials and methods. The bar graphs below each Western blotting (B and D) are a quantitation of the data in each blot. ERα expression was normalized to ß-actin as described in Materials and methods. These data are representative of at least five separate Western blots that show similar patterns of ERα expression.
Figure 3.
Figure 3.
KAT5, NPA87, and WRO thyroid cancer cells express ERß. The expression of ERß was examined by immunoblotting using 40 μg of WCE protein and using ERß polyclonal H150 antibody. H150 recognizes an epitope in the N terminus of ERß, as indicated by the black bar above the A/B domain in the ERß diagram provided at the top right. One and a half fmoles of recombinant human (rh) ERß was included as a control, as indicated. The membrane was stripped and reprobed for ß-actin. The migration of MW standards is indicated at the right (kDa). The MW sizes for the immunoreactive bands, indicated at the left by arrows, were estimated as described in Materials and methods. The bar graph is a quantitation of the data in each blot. This is the result of a single experiment and is representative of at least three separate Western blots that show similar patterns of ERß expression.
Figure 4.
Figure 4.
Cellular localization of ERα and ERß. MCF-7 human breast cancer cells (as a positive control) or the indicated thyroid cancer cell lines were treated with vehicle [EtOH (A) or 10 nM E2 for 45 min (B) and immunostained for ERα (red) and ERß (green) using an anti-ERα (AER320) and anti-ERß (H150) antibodies as described in Materials and methods]. Cell nuclei were counterstained with DAPI. Merged images are shown in the third column. Images were captured using Olympus iX50 inverted fluorescence microscope as described in Materials and methods. Scale bar, 10 μm.
Figure 5.
Figure 5.
ER transcriptional activity in thyroid cancer cells. (A) MCF-7 breast, or KAT5, NPA87, and WRO thyroid cancer cells were transiently transfected with pGL3-pro-2EREc38 luciferase and a Renilla reporter for a dual luciferase reporter assay as described in Materials and methods. Twenty-four hours post-transfection, the cells were treated with 10 nM E2, 100 nM ICI, 100 nM 4-OHT, 10 nM RAL, 10 nM DPN, and 10 nM PPT for 24 h. (B) MCF-7 breast, or KAT5, NPA87, and WRO thyroid cancer cells were transiently transfected with pGL3-pro-2EREc38 luciferase and a Renilla reporter for a dual luciferase reporter assay as described in Materials and methods. In addition, the cells were transfected with an empty expression vector (pcDNA3.1), or with the ERα or ERß expression plasmids, as indicated. The transfected cells were treated with EtOH or 10 nM E2 for 30 h. For (A and B), the luciferase response was normalized to vehicle (EtOH/DMSO). Values are the mean ± SEM of 3 independent experiments. *Significantly different compared to vehicle (EtOH) (p<0.05). **Significantly different from the E2 value (MCF-7 data in A).
Figure 6.
Figure 6.
Endogenous E2 target gene transcription in thyroid cancer cells. MCF-7 or the indicated thyroid cancer cells were treated with vehicle (EtOH), 10 nM E2, 100 nM ICI, or the combination for 6 h. Q-RT-PCR analysis of PR (inset) and cathepsin D (CTSD) were normalized to 18S and the fold comparison was against MCF-7 treated with EtOH as described in Materials and methods. E2 did not induce PR in any of the thyroid cancer cell lines and induced cathepsin D only in WRO cells. Values are the mean ± SEM of 3 independent experiments. *Significantly different from the EtOH value (P<0.05). **Significantly different from the E2 alone value in that cell line (P<0.05).
Figure 7.
Figure 7.
E2 induces cyclin D1 (CCND1) transcription in thyroid cancer cells. MCF-7 (A) or the indicated thyroid cancer cells (B-D) were treated with vehicle (EtOH), 10 nM E2, 100 nM ICI, or the combination for the indicated time. Q-PCR analysis of CCND1 was normalized to 18S and the fold comparison was against EtOH time zero for each cell line as described in Materials and methods. Values are the average ± SEM of three separate experiments. *Significantly different (P<0.05) from the EtOH value at that time. **Significantly different from the 10 nM E2 value at that time. Differences were examined within each cell line.
Figure 8.
Figure 8.
Knockdown of ERα and ERß in KAT5 and WRO cells reduces endogenous E2-target gene transcription. Transfection of KAT5 (A-B) and WRO (C-D) with siRNA against ERα and ERß selectively reduced ER subtype-specific mRNA expression 48 h after transfection and protein levels 72 h after transfection. Q-PCR and Western blots were performed and analyzed as described in Materials and methods. ESR1 and ESR2 mRNA values were normalized to 18S and the fold comparison was against siRNA negative control as described in Materials and methods. Quantification of the ER protein bands was performed as described in Materials and methods and presented relative to ß-actin with siRNA-transfected control set to 1. (E-F) Effect of knockdown of ER on ER target gene transcription. Cells were treated with 10 nM E2 or 100 nM ICI for 1 h for CCND1 (E and G) and 6 h for CTSD (F). The expression of CCND1 (E and G) and CTSD (F) was determined by Q-PCR, normalized to 18S, and the fold comparison was against EtOH as described in Materials and methods. Values are the average ± SEM of three separate experiments. *Significantly different from EtOH (P<0.05). **Significantly different from the E2 alone value for that gene in that cell line (P<0.05).
Figure 9.
Figure 9.
E2-induced ERK phosphorylation in thyroid cancer cell lines. KAT5 (A) and WRO (B) cells that had been transfected with control siRNA or siERα or siERß for 48 h were treated with 10 nM E2 or 100 nM ICI for 1 h. WCE were analyzed for ERK phosphorylation (p-ERK) and the blots were stripped and reprobed for total ERK (ERK). Densitometric values for p-ERK were normalized to ERK and control vehicle was set to 1.
Figure 10.
Figure 10.
GPR30 expression is lower in thyroid cancer cells than MCF-7 cells. Q-PCR was performed using ABI TaqMan primer/probes on untreated cells. The Ct values were normalized to 18S and normalized to MCF-7. Values are the average of 3 determinations ± SEM.

Similar articles

Cited by

References

    1. Correa P and Chen VW: Endocrine gland cancer. Cancer 75: 338–352, 1995. - PubMed
    1. Jemal A, Tiwari RC, Murray T, Ghafoor A, Samuels A, Ward E, Feuer EJ and Thun MJ: Cancer statistics, 2004. CA Cancer J Clin 54: 8–29, 2004. - PubMed
    1. Robbins J, Merino MJ, Boice JD Jr, Ron E, Ain KB, Alexander HR, Norton JA and Reynolds J: Thyroid cancer: a lethal endocrine neoplasm. Ann Intern Med 115: 133–147, 1991. - PubMed
    1. Yane K, Kitahori Y, Konishi N, Okaichi K, Ohnishi T, Miyahara H, Matsunaga T, Lin JC and Hiasa Y: Expression of the estrogen receptor in human thyroid neoplasms. Cancer Lett 84: 59–66, 1994. - PubMed
    1. Davies L and Welch HG: Increasing incidence of thyroid cancer in the United States, 1973–2002. JAMA 295: 2164–2167, 2006. - PubMed

Publication types