Review
. 2010 May;133(5):481-91.
doi: 10.1007/s00418-010-0692-z. Epub 2010 Apr 7.

Intravital microscopy: a novel tool to study cell biology in living animals

Affiliations
Review

Intravital microscopy: a novel tool to study cell biology in living animals

Roberto Weigert et al. Histochem Cell Biol. 2010 May.

Abstract

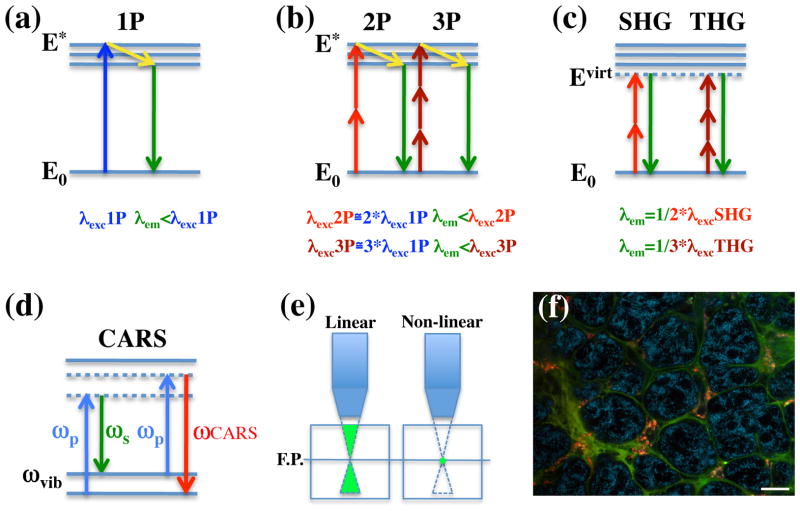
Intravital microscopy encompasses various optical microscopy techniques aimed at visualizing biological processes in live animals. In the last decade, the development of non-linear optical microscopy resulted in an enormous increase of in vivo studies, which have addressed key biological questions in fields such as neurobiology, immunology and tumor biology. Recently, few studies have shown that subcellular processes can be imaged dynamically in the live animal at a resolution comparable to that achieved in cell cultures, providing new opportunities to study cell biology under physiological conditions. The overall aim of this review is to give the reader a general idea of the potential applications of intravital microscopy with a particular emphasis on subcellular imaging. An overview of some of the most exciting studies in this field will be presented using resolution as a main organizing criterion. Indeed, first we will focus on those studies in which organs were imaged at the tissue level, then on those focusing on single cells imaging, and finally on those imaging subcellular organelles and structures.


Figures

Figure 1
Figure 1. Non linear optical microscopy
a–d Jablonski diagram illustrating (a) single photon (1P), (b) two-photon (2P) and three-photon (3P) excitation, (c) second (SHG) and third (THG) harmonic generation, and, (d) Coherent Anti-Stokes Raman Spectroscopy (CARS). a,b - In both single and MP microscopy, the emitted photons have a lower energy than the sum of the incident ones, due to some energy loss (yellow arrow). c – In SHG and THG the incident photons are scattered and recombine in a single one, without energy loss. d- In CARS microscopy two beams are used: the pump (ωp) and the stokes (ωs). When they are tuned to match a vibrational energy gap (ωvib), a strong anti-stokes signal is generated (ωCARS). Note that both in the harmonic emission and in CARS no electronic transitions occur. e) Non-linear emission occurs at the focal spot. f) Multiple fluorophores can be imaged using a single excitation wavelength. Alexa 488-dextran transferrin (green) and Texas Red–dextran (red) were injected in the submandibular glands of male rats and internalized into endosomal vesicles by fibroblast located in the stroma. After 1 hour, the glands were imaged by MPM using 750 nm as excitation wavelength. The endogenous fluorescence highlights the acinar structures (cyan). Note that both transferrin and dextran bind to the extracellular matrix surrounding the acini. Scale bar - 20 μm
Figure 2
Figure 2. Imaging the architecture of the tissues in live animals
a–i Excitation of intrinsic fluorescence to image tissue architecture. Rats were anesthetized and various organs such as liver (a), kidney (b), brain cortex (c), skeletal muscle (d), epididymis (f), bladder (g), prostate (h) and lacrimal glands (i) were imaged at a low magnification by using 740 nm as excitation wavelength. Scale bar - 100 μm. (i) The submandibular glands were imaged at a higher magnification (i) and details of the structure the acini (i′) and the large striated ducts (i″) are compared with the classical H&E staining (j). Scale bars - 10 μm. k–m Imaging the vasculature in live animal. Texas-Red dextran was systemically injected in anesthetized rats and the liver (k), the kidney (l) and the brain cortex (m) were imaged using 740 nm (k,l) or 920 nm (m) as excitation wavelength. n- Vasculature and salivary ducts in live animals. FITC dextran was injected systemically in anesthetized rats, whereas Texas-Red dextran was injected into the Wharton’s duct as described in Sramkova et al. 2009. The salivary glands were imaged by MPM using 920 nm as excitation wavelength. Scale bars 20 μm.
Figure 3
Figure 3. Imaging subcellular structures in live animals
a) Endocytosis of fluorescently labeled dextrans in the salivary glands of live rats. Anesthetized rats were injected with Hoechst to label the nuclei (blue), and imaged in time-lapse by using two-photon microscopy. After 2:30 minutes, a 500 kDa FITC-dextran was injected to label the vasculature (green) and after 6:00 min a 70 kDa Texas-red dextran was injected to image the endocytic process. Endocytic structures appeared right after the injection and they increased in number and in size over time (see supplementary movie 4). Excitation wavelength 820 nm. Scale bar - 20 μm. b) Imaging lysosomal fusion in a live animal. Rats were injected with Alexa 488 dextran (green) and Mitotracker (red) and after 4 hours the submandibular glands were imaged in time-lapse by using single photon confocal microscopy. Two lysosomal structures were caught during a fusion event (inset). Note the dynamics of both the lysosomes and the mitochondria in supplementary movie 5. Scale bar- 5 μm. c-e Gene transduction in live animal. The acinar cells of the salivary glands of live rats were transduced by using plasmid DNA encoding for different genes as described in Sramkova et al., 2009. c) Cell expressing TGN38-mCherry, which show the typical TGN ribbon-like structure (red, arrows), and the water channel Aquaporin5-YFP (arrowheads), localized both at the apical plasma membrane and in vesicular structures (arrowheads). d) Cell expressing Life Act-GFP to label F-actin (Riedl et al., 2008). Note the enrichment of F-actin at the apical pole of the plasma membrane. e) Cell expressing LifeAct-GFP (green) and TGN-mCherry (red, arrow). Texas red dextran was also injected systemically in the rat and appeared in a blood vessel (arrowheads, supplementary movie 6). Scale bars - 5 μm.

Similar articles

Cited by

References

    1. Alexander S, Koehl GE, Hirschberg M, Geissler EK, Friedl P. Dynamic imaging of cancer growth and invasion: a modified skin-fold chamber model. Histochem Cell Biol. 2008;130:1147–1154. - PubMed
    1. Andresen V, Alexander S, Heupel WM, Hirschberg M, Hoffman RM, Friedl P. Infrared multiphoton microscopy: subcellular-resolved deep tissue imaging. Curr Opin Biotechnol. 2009;20:54–62. - PubMed
    1. Ashworth SL, Tanner GA. Fluorescent labeling of renal cells in vivo. Nephron Physiol. 2006;103:p91–96. - PubMed
    1. Beck JS, Berg BN. The Circulatory Pattern in the Islands of Langerhans. Am J Pathol. 1931;7:31–36. 31. - PMC - PubMed
    1. Bestvater F, Spiess E, Stobrawa G, Hacker M, Feurer T, Porwol T, Berchner-Pfannschmidt U, Wotzlaw C, Acker H. Two-photon fluorescence absorption and emission spectra of dyes relevant for cell imaging. J Microsc. 2002;208:108–115. - PubMed

Publication types

LinkOut - more resources