. 2010 Sep;11(3):419-34.
doi: 10.1007/s10162-010-0214-7. Epub 2010 Apr 6.

Chronic reduction of endocochlear potential reduces auditory nerve activity: further confirmation of an animal model of metabolic presbyacusis

Affiliations

Chronic reduction of endocochlear potential reduces auditory nerve activity: further confirmation of an animal model of metabolic presbyacusis

Hainan Lang et al. J Assoc Res Otolaryngol. 2010 Sep.

Abstract

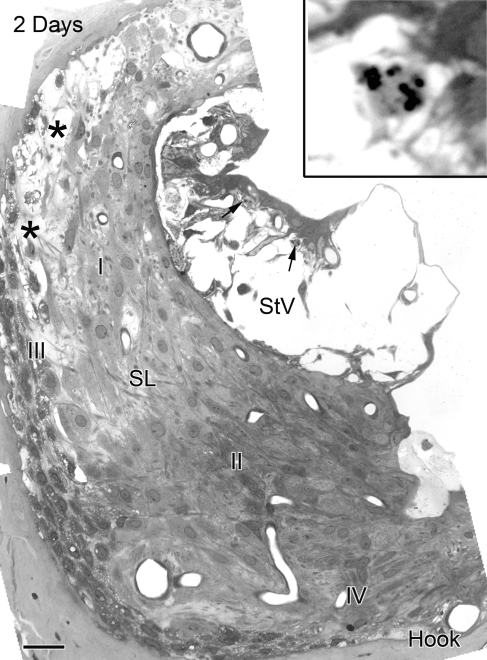
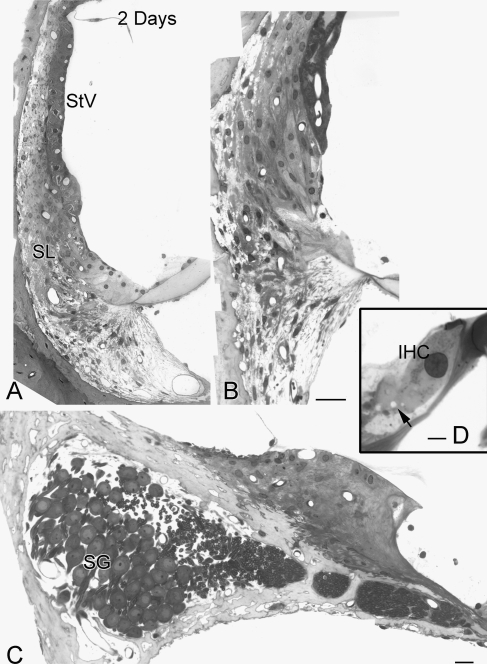
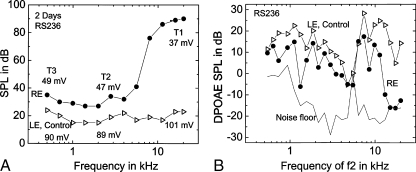
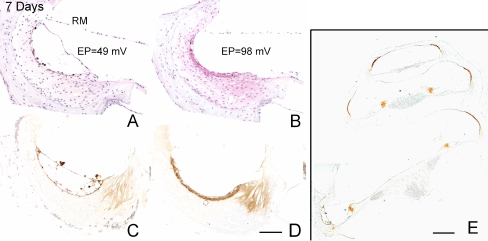
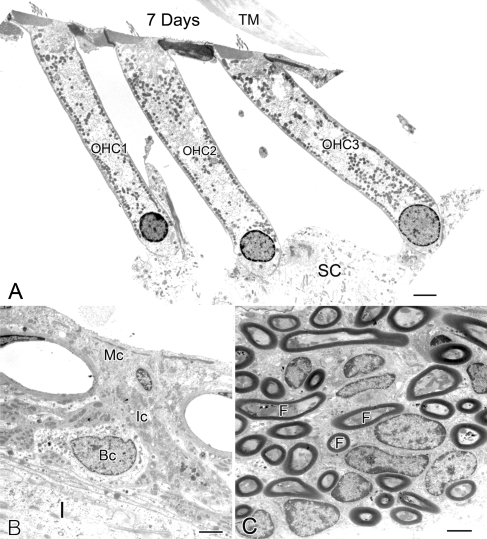
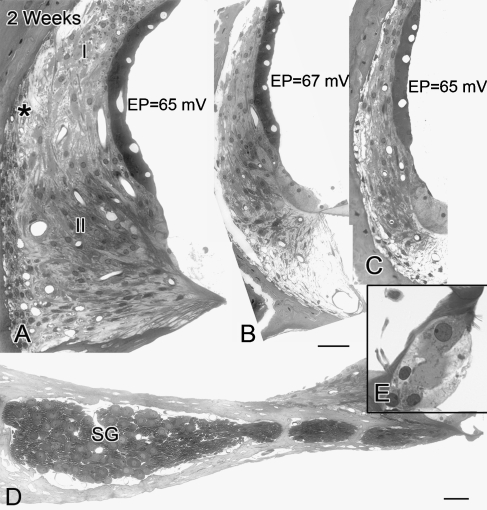
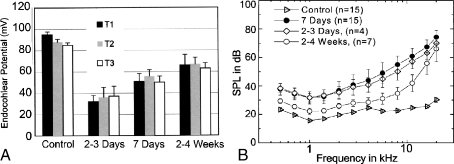
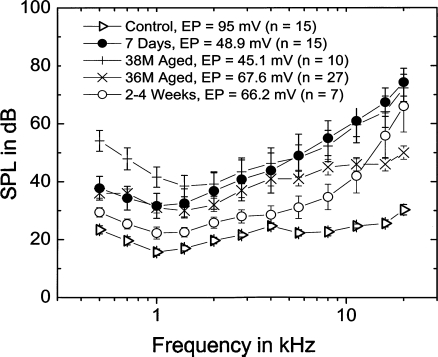
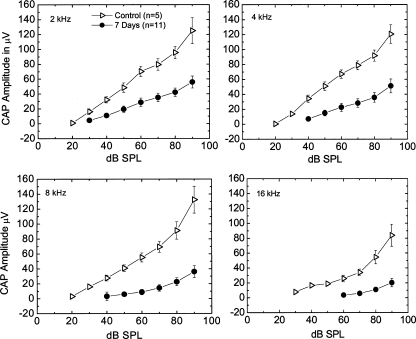
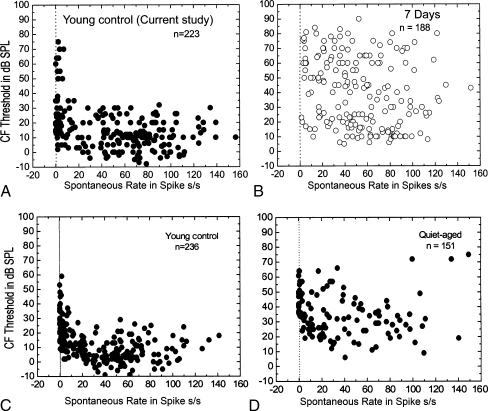
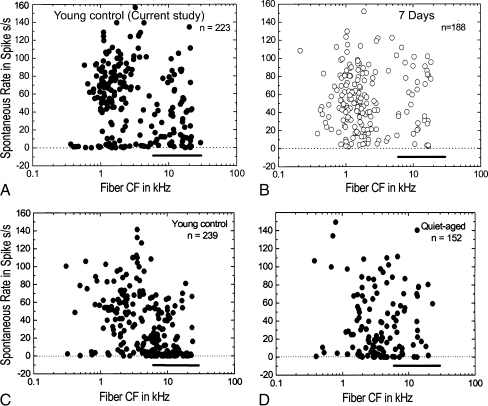
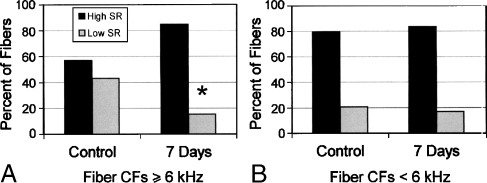
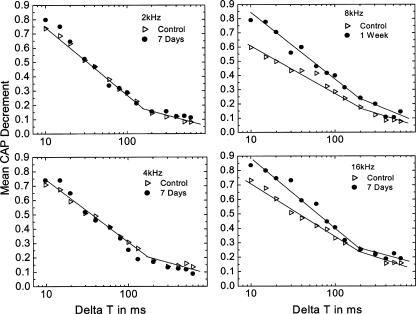
Gerbils aged in quiet show a decline of the endocochlear potential (EP) and elevated auditory nerve compound action potential (CAP) thresholds. However, establishing a direct relationship between an age-related reduction in the EP and changes in the activities of primary auditory neurons is difficult owing to the complexity of age-related histological changes in the cochlea. To address this issue, we developed a young gerbil model of "metabolic" presbyacusis that uses an osmotic pump to deliver furosemide into the round window niche for 7 days, resulting in a chronically reduced EP. In this model, the only major histopathologic changes were restricted to the hook region of the cochlea and consisted of loss of strial intermediate cells and massive edema in the lateral wall. The morphological and physiological evidence suggests that the cochlea can adapt to furosemide application over time. The morphology of spiral ganglion cells and hair cells appeared normal throughout the cochlea. CAP responses and EP values in this model are similar to those of quiet-aged ears. The spontaneous activity of single auditory fibers (n = 188) was assessed in 15 young gerbils treated with furosemide for 7 days. The percentage of recorded low-spontaneous rate (SR) fibers at characteristic frequencies (CFs) > or = 6 kHz was significantly lower in furosemide-treated than in control ears. Recovery function tests of CAP responses after prior stimulation also showed a decline in activity of the low-SR population with CFs > or = 6 kHz in the treated cochleas. A similar loss in the activity of low-SR fiber has been previously shown in quiet-aged gerbils. These results suggest that dysfunction of the cochlear lateral wall and subsequent chronic reduction in the EP can directly affect the activity patterns of primary auditory neurons in a manner similar to that seen in aged gerbils.


Figures

FIG. 1
FIG. 1
Pathological changes in the lateral wall of the hook region in an ear implanted with a furosemide pump for 2 days. Wide spaces separate basal, intermediate and basal cells in the stria vascularis. Many marginal cells are intact but have lost their basal processes. Apoptotic-like bodies are evident in the nuclei of some degenerating intermediate cells (arrows). Enlarged image (see inset) shows apoptotic bodies. Increased pericellular space separates type I from type III fibrocytes (asterisks). Numerous vacuoles populate the cytosol of type III fibrocytes. The appearance of type II and IV fibrocytes is relatively normal. This cochlear region is directly adjacent to the round window where the furosemide was applied. SL spiral ligament, StV stria vascularis. Scale bar = 10 µm.
FIG. 2
FIG. 2
Morphological features of the cochlear lateral wall in the upper basal and apical turn in the ear shown in Figure 1. A, B No pathologic changes are present in epithelial cells of the stria vascularis or fibrocytes of the spiral ligament in the upper basal and apical turns. C Spiral ganglion cell bodies and their processes in the upper basal turn appear normal. D Note that small vacuole-like spaces are sometimes seen beneath IHCs (arrow). SG spiral ganglion, IHC inner hair cell. Scale bars: A and B 15 µm; C 10 µm; D 5 µm.
FIG. 3
FIG. 3
Alterations of neural (CAP) responses and DPOAEs in the ear shown in Figures 1 and 2. Endocochlear potential, CAP thresholds, and DPOAE measurement in the treated (right ear, RE) and control (left ear, LE) ears. A CAP thresholds in the treated ear are elevated by about 15 dB at frequencies below 4 kHz and by as much as 70 dB at higher frequencies as compared with the control ear. EP values declined by about 60 mV from control values in the basal turn (T1) and about 40 mV in the middle (T2) and apical (T3) turns. B DPOAE amplitudes were reduced, but remained relatively robust in the treated ear except above 12 kHz. Dotted curve is the acoustic noise floor.
FIG. 4
FIG. 4
Reduction of immunoreactive NKCC in the stria vascularis of the extreme basal turn in an ear implanted with a furosemide pump for 7 days. A Hematoxylin and eosin stained radial section through the basal turn of the furosemide-treated right ear shows pathological changes in the stria vascularis. B Same region of the lateral wall in the untreated left ear has a normal appearance. The EP values obtained from T1 in treated and untreated ears were 49 and 98 mV, respectively. C, D Images obtained from sections adjacent to those in A and B show a remarkable loss of immunoreactive NKCC in the stria vascularis and inferior spiral ligament of the treated ear in this region near the round window as compared with the control ear. E Strong immunostaining for NKCC remains in the apical, middle, and upper basal turns of the treated ear. Scale bars: AD 20 µm; E 50 µm.
FIG. 5
FIG. 5
Ultrastructural features of the outer hair cells, stria vascularis, and auditory nerve fibers in an ear implanted with a furosemide pump for 7 days. A Three outer hair cells (1–3) in the middle turn appear healthy. SC supporting cells. B Marginal (Mc), intermediate (Ic), and basal (Bc) cells in the stria vascularis in the apical turn have a normal morphologic appearance. C Auditory nerve fibers (F) within the osseous spiral lamina have a normal appearance. Scale bars: A 4 µm; B, C 2 µm.
FIG. 6
FIG. 6
Cochlear morphology in an ear implanted with a furosemide pump for 2 weeks. A Edematous changes are absent in the stria vascularis of the hook region, whereas intercellular edema remains between type I and III fibrocytes. Note the cochlear turn in A is slightly more apical than that shown in Figure 1. Numerous vacuoles are present in the cytosol of type III fibrocytes (large asterisk). B, C The stria vascularis and spiral ligament in the middle and apical turns show no significant pathologic changes. D Spiral ganglion cell bodies and their processes in the extreme basal turn of this furosemide-treated ear also show no pathologic change. E The hair cells have normal appearance. Scale bars: 15 µm.
FIG. 7
FIG. 7
Cochlear adaptation to chronic furosemide exposure. A Mean EP values obtained from turns T1, T2, and T3 are presented as mean ± SEM (n = 5 for a 2–3 day group; n = 15 for a 1 week group; n = 7 for a 2–4 week group; n = 15 for young controls). The EP values increase with longer exposure times in all the three cochlear turns. B Mean CAP thresholds obtained from the same ears as shown in A. Thresholds of both the 2–3 day and 1 week exposed groups were elevated by about 40 dB at high frequencies and 15–20 dB at middle and low frequencies compared with those of control ear. However, thresholds in the 2–4 week group were only elevated by about 5 dB at low and middle frequencies, whereas the thresholds at high frequencies approached to those of the 2–3 day and 7 day groups.
FIG. 8
FIG. 8
Similarities in CAP thresholds and EP values in furosemide-treated and quiet-aged ears. Mean CAP thresholds and EP values in gerbils treated for 7 days compared with those from two groups of quiet-aged gerbils. Mean data are shown for the 7 day furosemide group (n = 15), the 36-month-old group (n = 27), and the 38–45-month-old group (n = 10).
FIG. 9
FIG. 9
Alterations of supra-threshold neural responses in furosemide-treated ears. Mean CAP I/O functions obtained with 2, 4, 8, and 16 kHz probe tones from control ears (n = 5) and ears treated with furosemide for 7 days (n = 11). Error bars are SEM values. Note that I/O functions from furosemide-treated gerbils have shifted thresholds and are flattened at all test frequencies. Because these animals were young with no hair cell and ganglion cell pathologies, it is most probably the reduced EP that is causing these shifts.
FIG. 10
FIG. 10
Alterations of CF thresholds and spontaneous rates in furosemide-treated ears. A CF threshold is plotted against spontaneous rate (SR) for 223 fibers from 11 young gerbils. B CF threshold is plotted against SR for 188 fibers from 15 furosemide-treated ears. C CF threshold is plotted against SR for 236 fibers from 11 young gerbils. D CF threshold is plotted against SR for 151 fibers from ten quiet-aged gerbils. Note that data shown in panels C and D have been replotted from a previous aging study in gerbils (Schmiedt et al. 1996). It is clear that differences in low-SR and high-SR thresholds are greatly reduced in the treated and aged ears.
FIG. 11
FIG. 11
Alterations of the spontaneous rate profile in furosemide-treated ears. A SR is plotted against CF for 223 fibers from 11 young control gerbils. Note the large number of low-SR fibers at CFs ≥ 6 kHz (heavy bar). B SR is plotted against CF for 188 fibers from 15 furosemide-treated gerbils. There is a relative absence of low-SR fibers with high CFs in the furosemide-treated group (heavy bar). All furosemide-treated gerbils received 5 mg/ml furosemide for 7 days. C SR is plotted against CF for 239 fibers from a previous group of 11 young control gerbils. Again, note the large number of low-SR fibers with CFs ≥ 6 kHz (heavy bar). D SR is plotted against CF for 151 fibers from ten aged gerbils. Note the relative absence of low-SR fibers at CFs ≥ 6 kHz (heavy bar) like that seen with furosemide treatment. The data in panels C and D were taken from a previous study on aged gerbils (Schmiedt et al. 1996).
FIG. 12
FIG. 12
Bar graphs of the spontaneous rate data from the same fiber population shown in Figure 11. Data include 223 fibers from 11 young gerbils and 188 fibers from 15 furosemide-treated gerbils. A The percent of auditory nerve fibers with CFs ≥ 6 kHz contacted with high-SR (dark bars) or low-SR (light bars). In young controls, ∼43% of the fibers contacted are low-SR fibers; in furosemide-treated gerbils, this percentage drops to ∼15%. The percentages of low-SR fibers are significantly different between the young and the furosemide-treated gerbils (p < 0.01, chi-square test). B The percent of auditory nerve fibers with CFs < 6 kHz contacted with high-SR (dark bars) or low-SR (light bars) as shown in Figure 11B. In young controls, ∼ 21% of the fibers contacted with CFs < 6 kHz were low-SR fibers; in furosemide-treated gerbils, this percentage was ∼ 17 %. There were no significant difference at CFs < 6 kHz in the percentages of low-SR fibers between the young and the furosemide-treated gerbils (p > 0.05, chi-square test).
FIG. 13
FIG. 13
CAP recovery functions in furosemide-treated ears. Left panels: Mean CAP recovery curves in terms of the normalized decrement as a function of ΔT at frequencies of 2 (top) and 4 kHz (bottom). The data are from five ears treated with furosemide for 7 days and five young control ears. All furosemide-treated gerbils were implanted with a 5 mg/ml furosemide pump for 7 days. There were no significant differences between the furosemide-treated and control groups at these frequencies. Regression analysis shows a significant change of slope for points above and below ΔT = 130 ms (p < 0.01). Right panels: Mean CAP recovery curves obtained at 8 (top) and 16 kHz (bottom) from the same gerbils show in left panels. At these higher frequencies, there are significant differences between the furosemide-treated and untreated groups. The recovery time constant is significantly shorter in the treated group, indicating a decreased number of active low-SR fibers compared with that in normal controls, corroborating the single fiber data shown in Figure 12.

References

    1. Conlee JW, Gerity LC, Bennett ML (1994) Ongoing proliferation of melanocytes in the stria vascularis of adult guinea pigs. Hear Res 79(1–2):115–122 - PubMed
    1. Cooper NP, Rhode WS. Basilar membrane mechanics in the hook region of cat and guinea-pig cochleae: sharp tuning and nonlinearity in the absence of baseline position shifts. Hear Res. 1992;63(1–2):163–190. doi: 10.1016/0378-5955(92)90083-Y. - DOI - PubMed
    1. Crouch JJ, Sakaguchi N, Lytle C, Schulte BA. Immunohistochemical localization of the Na–K–Cl co-transporter (NKCC1) in the gerbil inner ear. J Histochem Cytochem. 1997;45(6):773–778. - PubMed
    1. Davis H. A mechano-electric theory of cochlear action. Ann Otol Rhinol Laryngol. 1958;67:789–801. - PubMed
    1. Davis H. A model for transducer action in the cochlea. Cold Spring Harb Symp Quant Biol. 1965;30:180–190. - PubMed

Publication types

Substances