. 2010 Aug;67(16):2839-50.
doi: 10.1007/s00018-010-0365-z. Epub 2010 Apr 8.

Optic atrophy 3 as a protein of the mitochondrial outer membrane induces mitochondrial fragmentation

Affiliations

Optic atrophy 3 as a protein of the mitochondrial outer membrane induces mitochondrial fragmentation

Seung-Wook Ryu et al. Cell Mol Life Sci. 2010 Aug.

Abstract

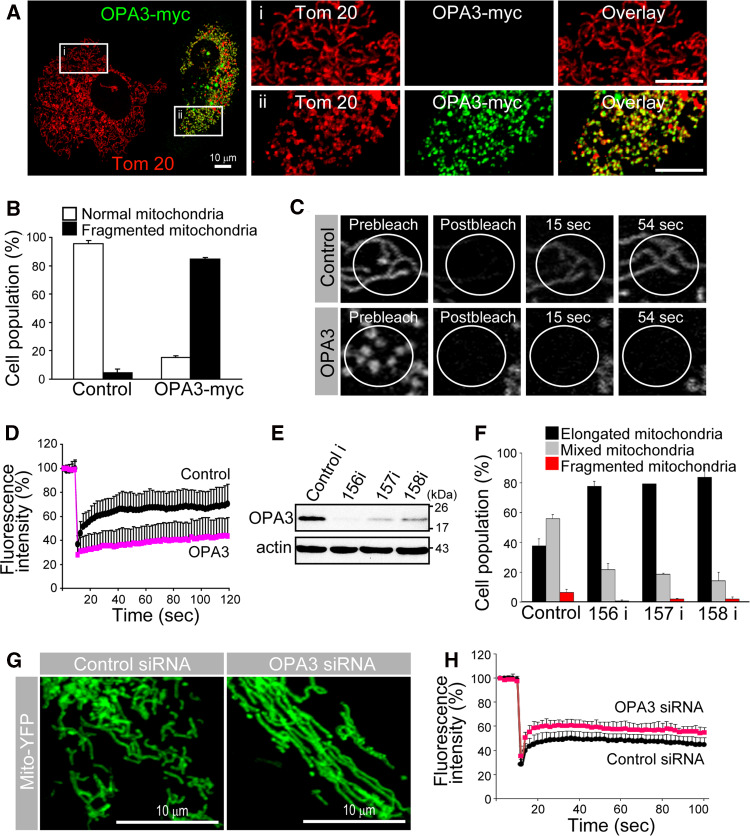
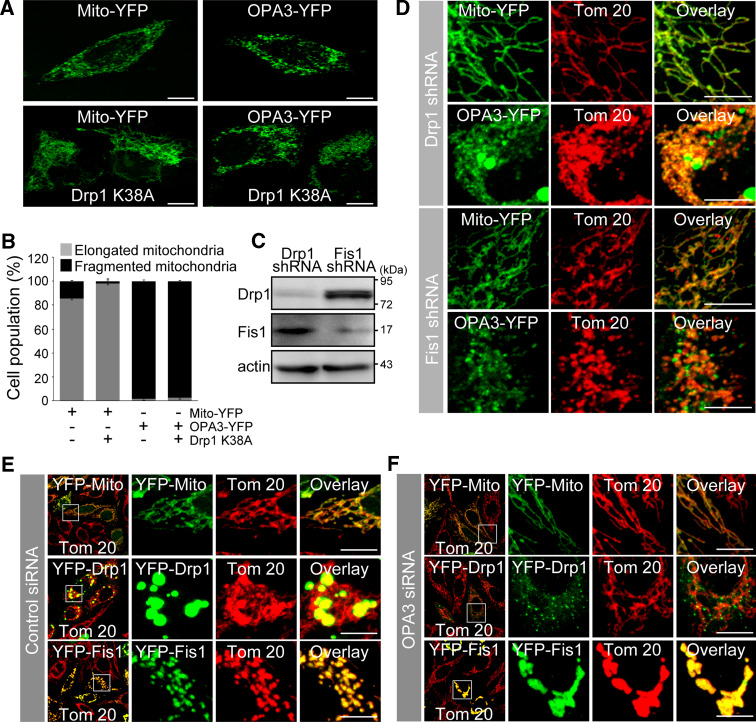
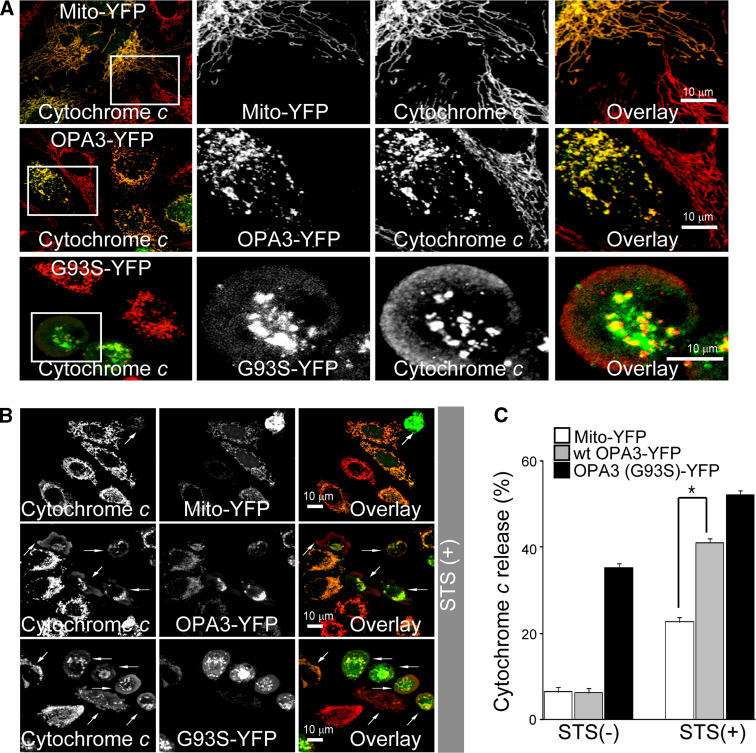
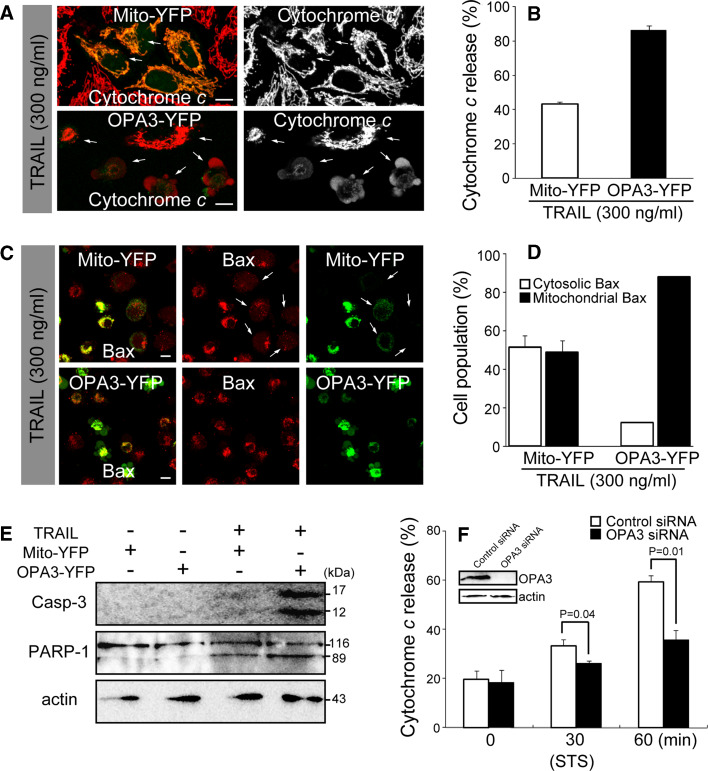
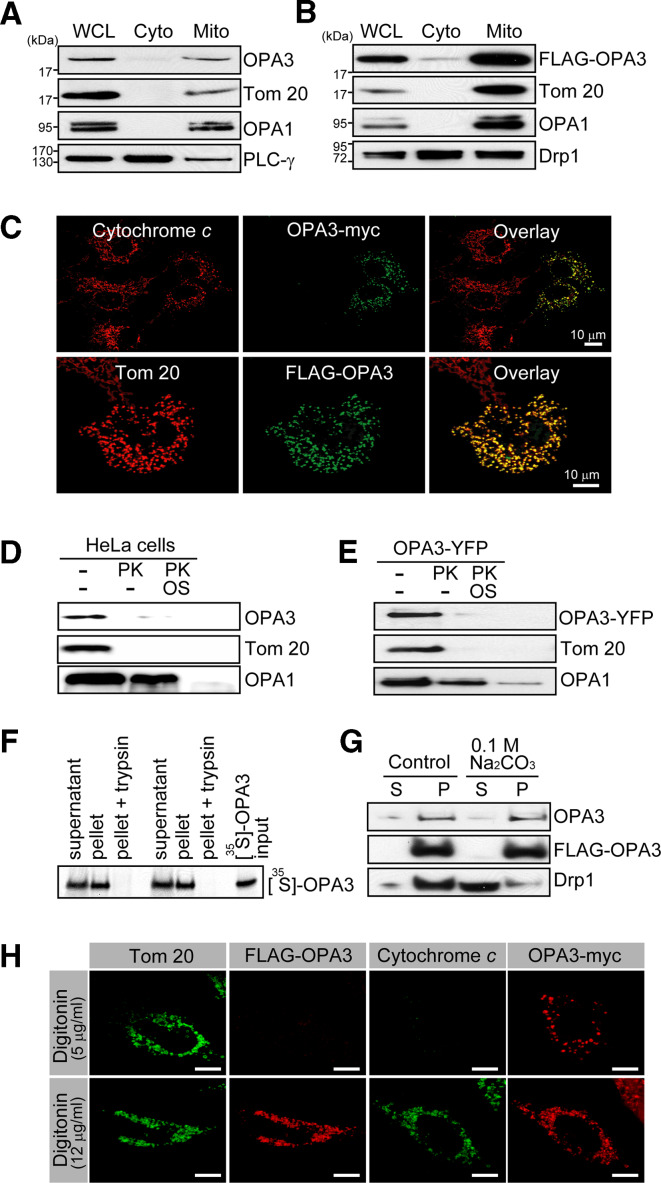
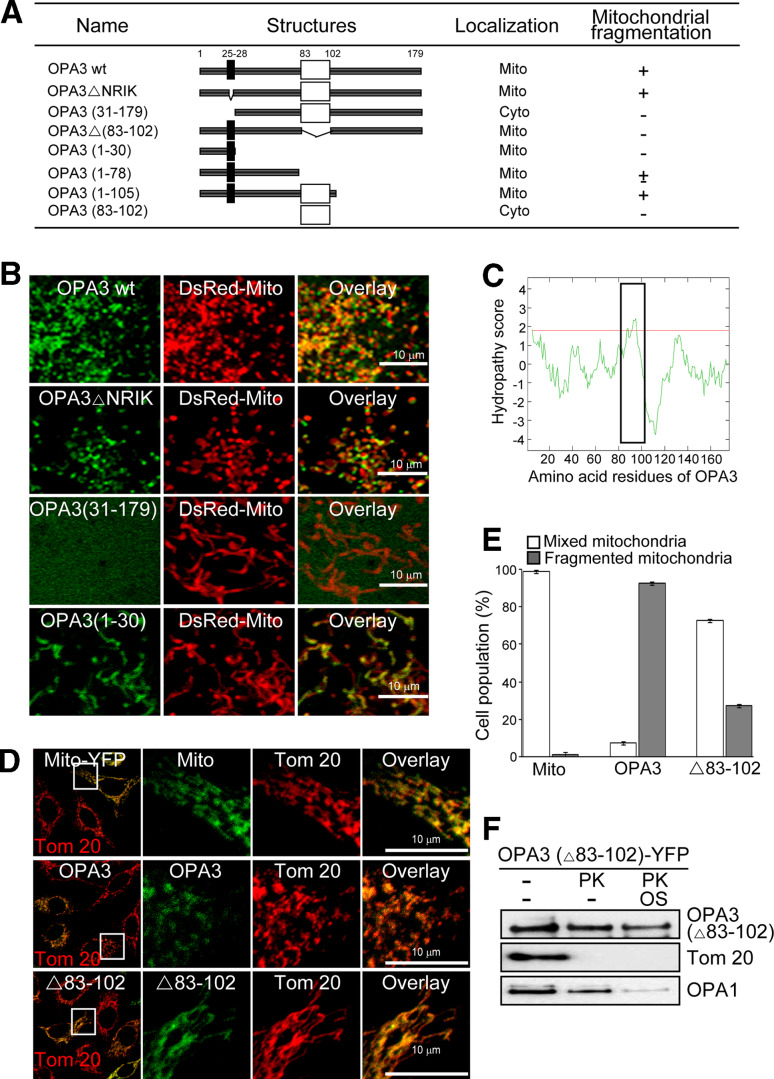
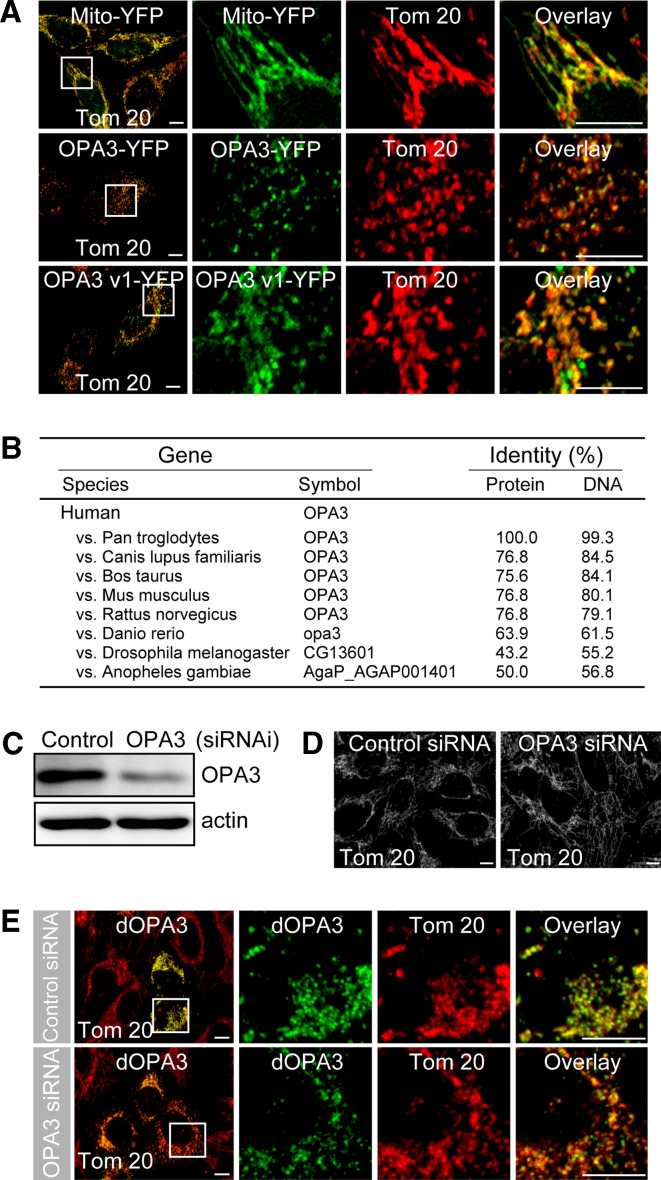
The optic atrophy 3 (OPA3) gene, which has no known homolog or biological function, is mutated in patients with hereditary optic neuropathies. Here, we identified OPA3 as an integral protein of the mitochondrial outer membrane (MOM), with a C-terminus exposed to the cytosol and an N-terminal mitochondrial targeting domain. By quantitative analysis, we demonstrated that overexpression of OPA3 significantly induced mitochondrial fragmentation, whereas OPA3 knockdown resulted in highly elongated mitochondria. Cells with mitochondria fragmented by OPA3 did not undergo spontaneous apoptotic cell death, but were significantly sensitized to staurosporine- and TRAIL-induced apoptosis. In contrast, overexpression of a familial OPA3 mutant (G93S) induced mitochondrial fragmentation and spontaneous apoptosis, suggesting that OPA3 mutations may cause optic atrophy via a gain-of-function mechanism. Together, these results indicate that OPA3, as an integral MOM protein, has a crucial role in mitochondrial fission, and provides a direct link between mitochondrial morphology and optic atrophy.


Figures

Fig. 1
Fig. 1
Effect of OPA3 on mitochondrial morphology. a, b Cells were stained with fluorescently labeled anti-myc (green) and anti-Tom 20 (red) antibodies. Higher magnification of the white square is presented in the right panel: top without OPA3-myc (i); and bottom with OPA3-myc (ii). Data are the mean ± SD of three experiments, each with 100 cells per treatment. Bar 10 μm. c, d The white circle (ROI) is the photobleached area monitored for recovery of mito-YFP fluorescence. Each line represents the mean of >70 measurements (d). e Total extracts from cells transfected with OPA3 RNAi (156i, 157i, and 158i) were analyzed by Western blotting with anti-OPA3 antibody. Actin was used as a loading control. f, g Mitochondria with OPA3 siRNA or control siRNA, together with mito-YFP, were analyzed by confocal microscopy. The number of cells displaying normal mitochondria (mixed), elongated mitochondria, and fragmented mitochondria were counted. Data are the mean ± SD of three experiments, each with 100 cells per treatment. h The fusion activity of individual mitochondria measured by fluorescence recovery after photobleaching in living OPA3-depleted HeLa cells
Fig. 2
Fig. 2
Effect of OPA3 depletion on DRP1/FIS1-mediated mitochondrial fission. a, b HeLa cells were transfected with the indicated constructs (1:3 ratios). After 15 h, the cells were fixed and analyzed by confocal microscopy. Bar 10 μm. c HeLa cells stably transfected with DRP1 shRNA or FIS1 shRNA were harvested and analyzed by Western blotting with anti-DRP1, anti-FIS1, and anti-actin antibodies. d HeLa cells stably expressing DRP1 shRNA or FIS1 shRNA were transfected with the indicated constructs. Cells were fixed, stained with anti-Tom 20 antibody (red) and analyzed by confocal microscopy. Bar 10 μm. eg HeLa cells were transfected with control siRNA (e) or OPA3 siRNA (f), along with mito-YFP, YFP-DRP1, or YFP-FIS1. Cells were fixed, stained with anti-Tom 20 (red) and analyzed by confocal microscopy. Higher magnification of the white square is presented in the right panel of the merged image. Bar 10 μm
Fig. 3
Fig. 3
Overexpression of OPA3 increases the release of cytochrome c with apoptotic stimuli. a, b HeLa cells were transfected with the indicated constructs. After 15 h, the cells were treated without (a) or with (b) 1 μM STS for 30 min, stained with fluorescently labeled anti-cytochrome c antibody (red), and analyzed by confocal microscopy. Higher magnification of the white square a is presented in the right panel of the merged image. Bar 10 μm. White arrows b indicate cells with YFP and cytosolic cytochrome c. c The number of cells displaying cytosolic and mitochondrial cytochrome c were counted and are shown as a percentage of the total cells counted in each green image cell population. Data are the mean ± SD of three experiments, each with 100 cells per condition. *p < 0.05
Fig. 4
Fig. 4
Overexpression of OPA3 leads to apoptotic sensitivity of cells. ae HeLa cells were transfected with the indicated constructs. Cells were treated with TRAIL for 6 h, stained with fluorescently labeled anti-cytochrome c antibody (a) or anti-Bax antibody (c), and analyzed by confocal microscopy. The number of cells displaying cytosolic cytochrome c (b) and Bax translocation (d) were counted, and are shown as a percentage of the total cells counted in each green image cell population. Data are the mean ± SD of three experiments, each with 100 cells per condition. Bar 10 μm. White arrows indicate cells with YFP and cytosolic cytochrome c (a), or with YFP and cytosolic Bax (c). e Caspase-3 activation and PARP cleavage were assessed by Western blotting with the indicated antibodies. f HeLa cells were transfected with the control siRNA or OPA3 siRNA. Cells were treated with 1 μM STS for the indicated time. Cells were stained with anti-cytochrome c antibody, and then analyzed by confocal microscopy. The numbers of cells displaying cytosolic cytochrome c were counted, and are shown as a percentage of the total cells counted. Data are the mean ± SD of three experiments, each with 100 cells per condition. Knockdown of OPA3 was assessed by Western blotting using anti-OPA3 and anti-actin antibodies (f)
Fig. 5
Fig. 5
Localization of OPA3 on the mitochondrial outer membrane (MOM). a, b HeLa cells or FLAG-OPA3-expressing HeLa cells were harvested. Two subcellular fractions were prepared, cytosol (Cyto) and mitochondria (Mito), and analyzed by Western blotting with the indicated antibodies. WCL Whole-cell lysate. c HeLa cells (upper panel) and COS7 cells (low panel) were transfected with OPA3-myc and FLAG-OPA3, respectively. Cells were fixed, and stained with fluorescently labeled anti-cytochrome c and anti-myc antibodies, or anti-Tom 20 and anti-FLAG antibodies, followed by confocal microscopy. Mitochondrial fractions (d) and mitochondrial fraction with OPA3-YFP (e) in control buffer or swelling buffer (OS) were digested by proteinase K (PK). Western blots of the separated proteins were probed with anti-OPA3, anti-GFP, anti-Tom 20, and anti-OPA1 antibodies. f Mitochondria labeled with in vitro translated [35S]-OPA3 were incubated with and without 200 μg/ml trypsin. Proteins were separated by SDS-PAGE. [35S]-OPA3 was detected using Kodak X-ray film. g Alkali (Na2CO3)-treated mitochondria were extracted and subjected to further ultracentrifugation to separate soluble (S) and pelleted proteins (P). Western blots of the separated proteins were probed with anti-OPA3, anti-FLAG, and anti-DRP1 antibodies. h Cells with FLAG-OPA3 or OPA3-myc were permeabilized with the indicated concentrations of digitonin and were co-immunostained with fluorescently labeled anti-FLAG and anti-Tom 20 antibodies, or anti-myc, and anti-cytochrome c antibodies. Bar 10 μm
Fig. 6
Fig. 6
Hydrophobic region of OPA3 in the MOM is sufficient to trigger mitochondrial fragmentation. a Diagram of C-terminally YFP-fused OPA3 deletion mutants; +, fragmented mitochondria; Mito, mitochondria; Cyto, cytoplasm. b HeLa cells were transfected with the indicated constructs and analyzed by confocal microscopy. DsRed-Mito was used as a mitochondrial marker. c The amino acid sequence of OPA3 was analyzed by Kyte-Doolittle hydropathy plot server. The putative membrane-spanning segment is shown as a black rectangle. d, e Cells were co-transfected with the indicated constructs. Mitochondrial morphology was analyzed by confocal microscopy. Data are the mean ± SD of three experiments, each with 100 cells per treatment. f Mitochondrial fractions with OPA3 (Δ83–102)-YFP in control buffer or swelling buffer (OS) were digested by proteinase K (PK). Western blots of the separated proteins were probed with anti-GFP, anti-Tom 20, and anti-OPA1 antibodies
Fig. 7
Fig. 7
OPA3 orthologs in several species can induce mitochondrial fragmentation. a HeLa cells were transfected with the indicated constructs. Cells were fixed and stained with anti-Tom 20 antibody (red). Mitochondrial morphology was analyzed by confocal microscopy. Bar 10 μm. b Diagram showing high amino acid sequence identity with that of human OPA3. ce HeLa cells were transfected with OPA3 siRNA or control siRNA, together with Drosophila OPA3 (dOPA3). Knockdown of OPA3 was assessed by Western blotting using anti-OPA3 and anti-actin antibodies (c). Cells were fixed, stained with anti-Tom 20 antibody (red) and analyzed by confocal microscopy. Higher magnification of the white square is presented in the right panel of the merged image. Bar 10 μm

Similar articles

Cited by

References

    1. Nunnari J, Marshall WF, Straight A, Murray A, Sedat JW, Walter P. Mitochondrial transmission during mating in Saccharomyces cerevisiae is determined by mitochondrial fusion and fission and the intramitochondrial segregation of mitochondrial DNA. Mol Biol Cell. 1997;8:1233–1242. - PMC - PubMed
    1. Yaffe MP. The machinery of mitochondrial inheritance and behavior. Science. 1999;283:1493–1497. doi: 10.1126/science.283.5407.1493. - DOI - PubMed
    1. Shaw JM, Nunnari J. Mitochondrial dynamics and division in budding yeast. Trends Cell Biol. 2002;12:178–184. doi: 10.1016/S0962-8924(01)02246-2. - DOI - PMC - PubMed
    1. Honda S, Hirose S. Stage-specific enhanced expression of mitochondrial fusion and fission factors during spermatogenesis in rat testis. Biochem Biophys Res Commun. 2003;311:424–432. doi: 10.1016/j.bbrc.2003.10.008. - DOI - PubMed
    1. Youle RJ, Karbowski M. Mitochondrial fission in apoptosis. Nat Rev Mol Cell Biol. 2005;6:657–663. doi: 10.1038/nrm1697. - DOI - PubMed

Publication types

MeSH terms

LinkOut - more resources