

Multiexponential T2, magnetization transfer, and quantitative histology in white matter tracts of rat spinal cord
- PMID: 20373391
- PMCID: PMC2852261
- DOI: 10.1002/mrm.22267
Multiexponential T2, magnetization transfer, and quantitative histology in white matter tracts of rat spinal cord
Abstract
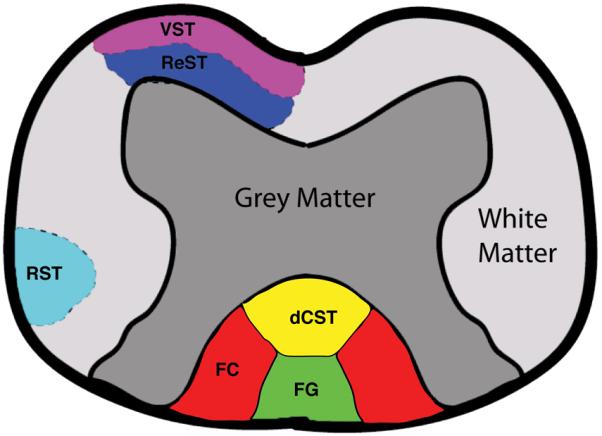
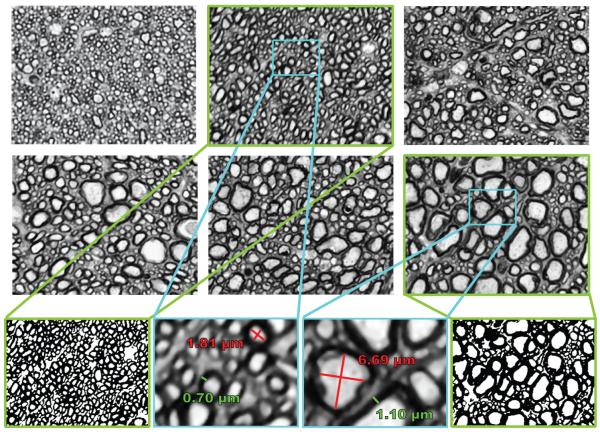
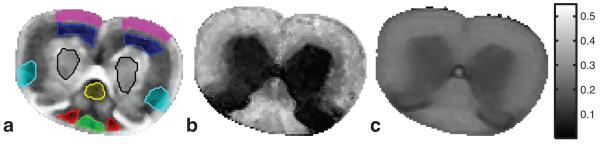
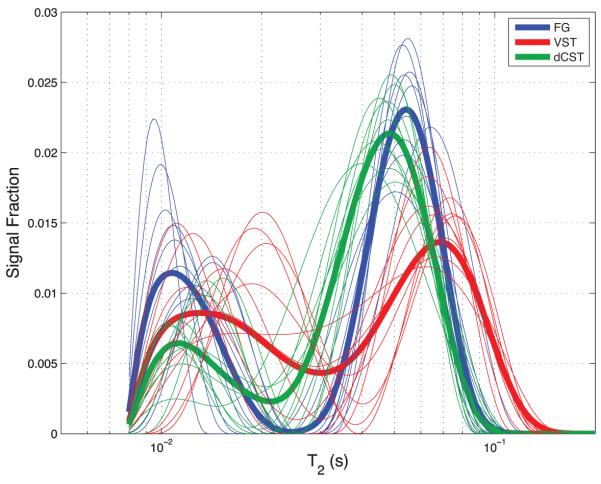
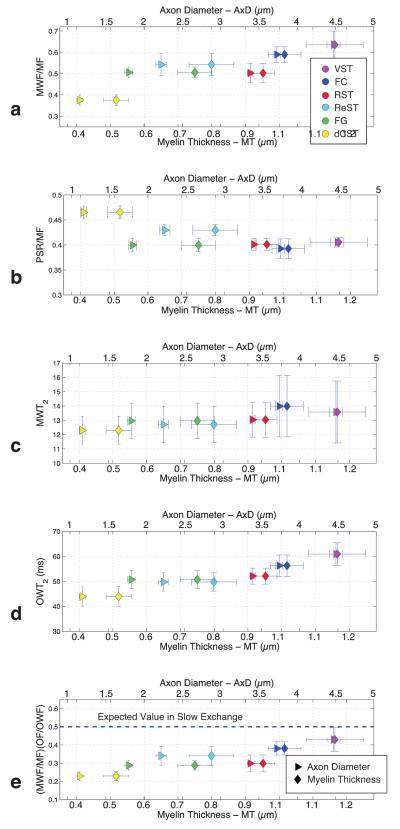
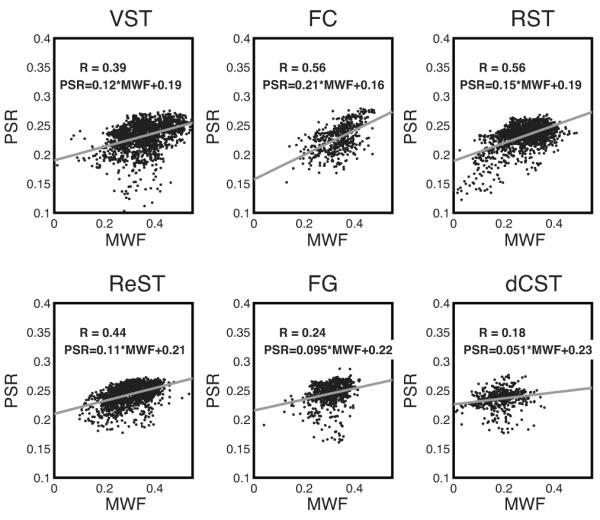
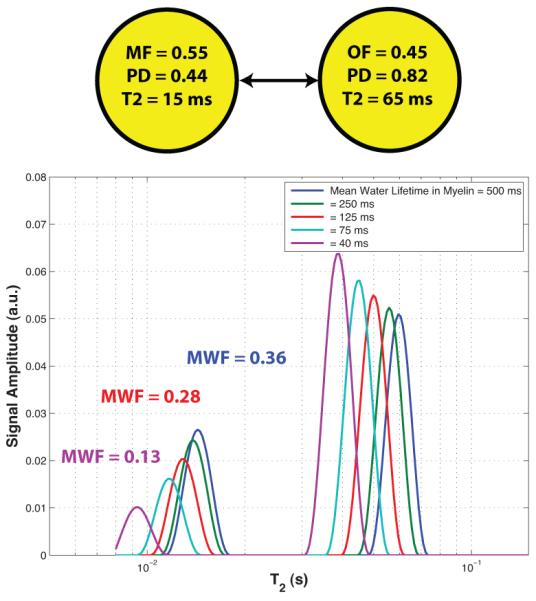
Quantitative MRI measures of multiexponential T(2) relaxation and magnetization transfer were acquired from six samples of excised and fixed rat spinal cord and compared with quantitative histology. MRI and histology data were analyzed from six white matter tracts, each of which possessed unique microanatomic characteristics (axon diameter and myelin thickness, in particular) but a relatively constant volume fraction of myelin. The results indicated that multiexponential T(2) relaxation characteristics varied substantially with variation of microanatomy, while the magnetization transfer characteristics remained close to constant. The most-often-cited multiexponential T(2) relaxation metric, myelin water fraction, varied by almost a factor of 2 between two regions with myelin volume fractions that differed by only approximately 12%. Based on the quantitative histology, the proposed explanation for this variation was intercompartmental water exchange, which caused the underestimation of myelin water fraction and T(2) values and is, presumably, a greater factor in white matter regions where axons are small and myelin is thin. In contrast to the multiexponential T(2) relaxation observations, magnetization transfer metrics were relatively constant across white matter tracts and concluded to be relatively insensitive to intercompartmental water exchange.
Figures
Similar articles
-
Effect of intercompartmental water exchange on the apparent myelin water fraction in multiexponential T2 measurements of rat spinal cord.Magn Reson Med. 2012 Mar;67(3):793-800. doi: 10.1002/mrm.23053. Epub 2011 Jun 28. Magn Reson Med. 2012. PMID: 21713984 Free PMC article.
-
Two-dimensional magnetization-transfer - CPMG MRI reveals tract-specific signatures in fixed rat spinal cord.J Magn Reson. 2018 Dec;297:124-137. doi: 10.1016/j.jmr.2018.10.014. Epub 2018 Oct 24. J Magn Reson. 2018. PMID: 30388701
-
The microstructural correlates of T1 in white matter.Magn Reson Med. 2016 Mar;75(3):1341-5. doi: 10.1002/mrm.25709. Epub 2015 Apr 28. Magn Reson Med. 2016. PMID: 25920491 Free PMC article.
-
Characterization of cerebral white matter properties using quantitative magnetic resonance imaging stains.Brain Connect. 2011;1(6):423-46. doi: 10.1089/brain.2011.0071. Epub 2012 Jan 27. Brain Connect. 2011. PMID: 22432902 Free PMC article. Review.
-
MRI-based myelin water imaging: A technical review.Magn Reson Med. 2015 Jan;73(1):70-81. doi: 10.1002/mrm.25198. Epub 2014 Mar 6. Magn Reson Med. 2015. PMID: 24604728 Review.
Cited by
-
RAFF-4, Magnetization Transfer and Diffusion Tensor MRI of Lysophosphatidylcholine Induced Demyelination and Remyelination in Rats.Front Neurosci. 2021 Mar 4;15:625167. doi: 10.3389/fnins.2021.625167. eCollection 2021. Front Neurosci. 2021. PMID: 33746698 Free PMC article.
-
Diffusion MRI microstructural models in the cervical spinal cord - Application, normative values, and correlations with histological analysis.Neuroimage. 2019 Nov 1;201:116026. doi: 10.1016/j.neuroimage.2019.116026. Epub 2019 Jul 19. Neuroimage. 2019. PMID: 31326569 Free PMC article.
-
Myelin volume fraction imaging with MRI.Neuroimage. 2018 Nov 15;182:511-521. doi: 10.1016/j.neuroimage.2016.12.067. Epub 2016 Dec 23. Neuroimage. 2018. PMID: 28025129 Free PMC article.
-
In vivo imaging of neuroinflammation in schizophrenia.Schizophr Res. 2016 Jun;173(3):200-212. doi: 10.1016/j.schres.2015.05.034. Epub 2015 Jun 3. Schizophr Res. 2016. PMID: 26048294 Free PMC article. Review.
-
In-vivo multi-exponential T2, magnetization transfer and quantitative histology in a rat model of intramyelinic edema.Neuroimage Clin. 2013 Jun 22;2:810-7. doi: 10.1016/j.nicl.2013.06.007. eCollection 2013. Neuroimage Clin. 2013. PMID: 24179832 Free PMC article.
References
-
- MacKay A, Whittall K, Adler J, Li D, Paty D, Graeb D. In vivo visualization of myelin water in brain by magnetic resonance. Magn Reson Med. 1994;31(6):673–677. - PubMed
-
- Menon RS, Rusinko MS, Allen PS. Proton relaxation studies of water compartmentalization in a model neurological system. Magn Reson Med. 1992;28(2):264–274. - PubMed
-
- Koenig SH, Brown RD, Spiller M, Lundbom N. Relaxometry of Brain - Why White Matter Appears Bright in Mri. Magnetic Resonance in Medicine. 1990;14(3):482–495. - PubMed
-
- Kucharczyk W, Macdonald PM, Stanisz GJ, Henkelman RM. Relaxivity and Magnetization-Transfer of White-Matter Lipids at Mr-Imaging - Importance of Cerebrosides and Ph. Radiology. 1994;192(2):521–529. - PubMed
Publication types
MeSH terms
Substances
Grants and funding
LinkOut - more resources
Full Text Sources
Other Literature Sources
Medical
