

High-resolution magnetic resonance colonography and dynamic contrast-enhanced magnetic resonance imaging in a murine model of colitis
- PMID: 20373393
- PMCID: PMC3086519
- DOI: 10.1002/mrm.22229
High-resolution magnetic resonance colonography and dynamic contrast-enhanced magnetic resonance imaging in a murine model of colitis
Abstract
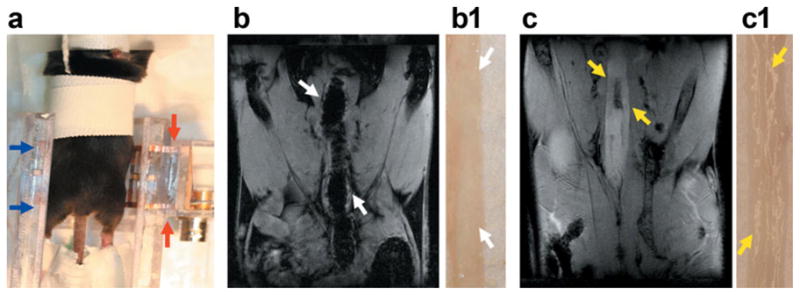
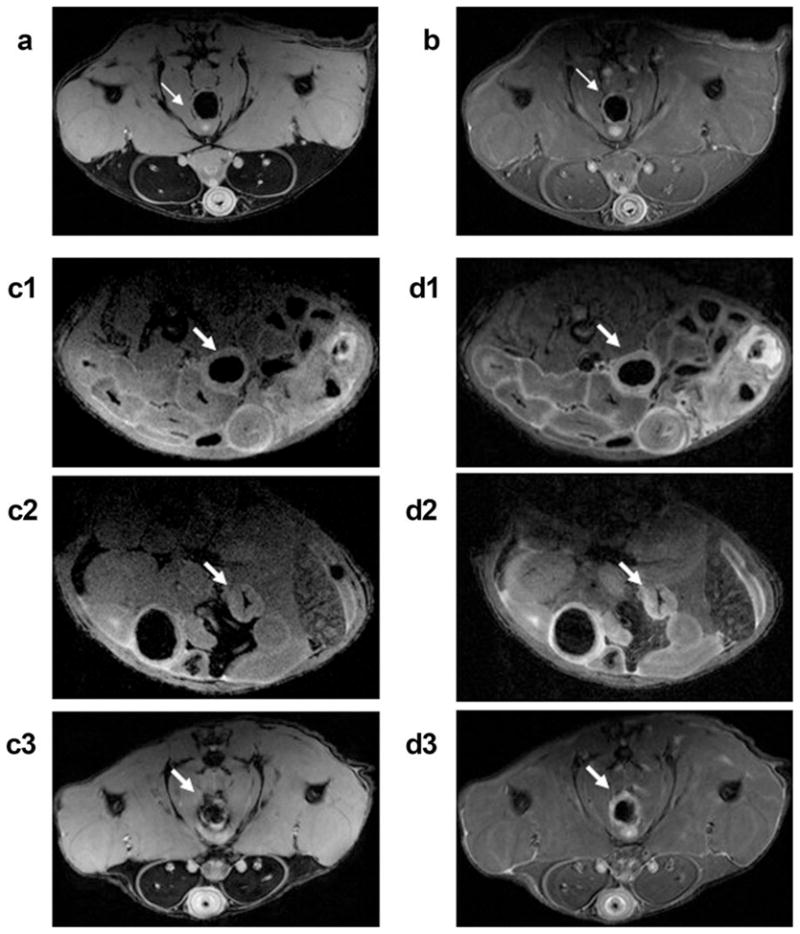
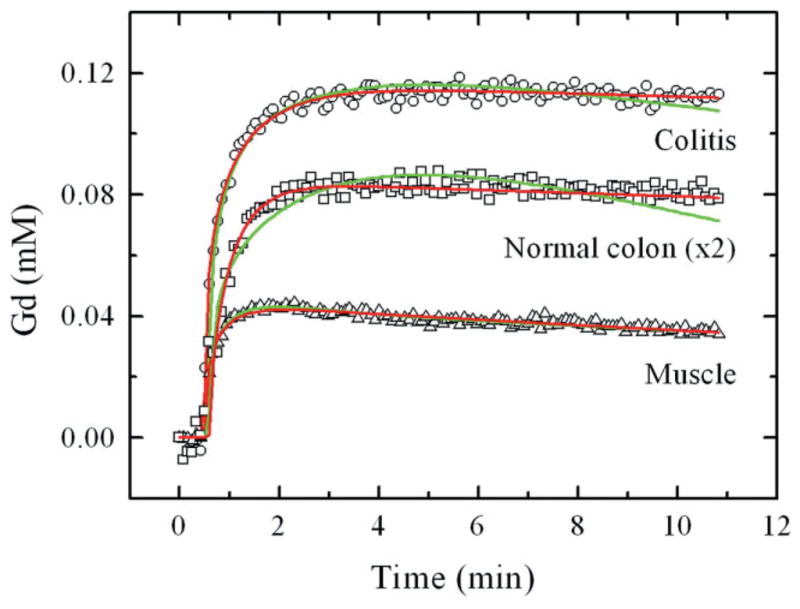
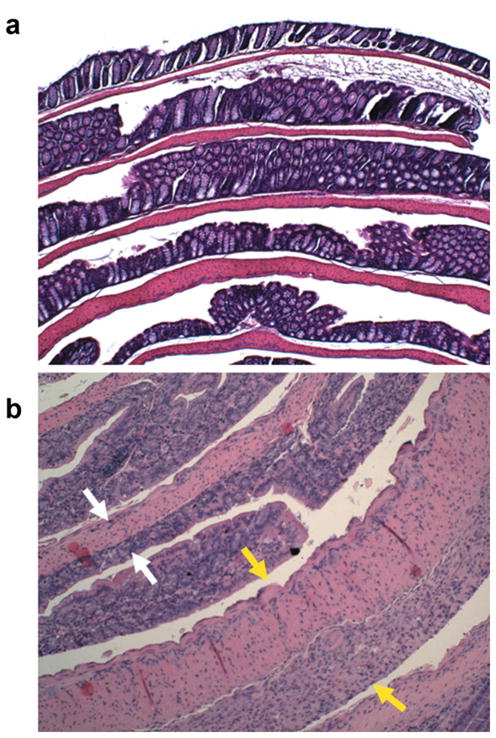
Inflammatory bowel disease, including ulcerative colitis, is characterized by persistent or recurrent inflammation and can progress to colon cancer. Colitis is difficult to detect and monitor noninvasively. The goal of this work was to develop a preclinical imaging method for evaluating colitis. Herein, we report improved MRI methods for detecting and characterizing colitis noninvasively in mice, using high-resolution in vivo MR images and dynamic contrast-enhanced MRI studies, which were confirmed by histologic studies in a murine model of colitis. C57Bl6/J male mice were treated with 2.5% dextran sulfate sodium in their drinking water for 5 days to induce colitis. MR images were acquired using a 9.4-T Bruker scanner from 5-25 days following dextran sulfate sodium treatment. In dynamic contrast-enhanced MRI studies, Gd uptake (K(trans)) and its distribution (v(e)) were measured in muscle and normal and inflamed colons after administering Gd-diethyltriaminepentaacetic acid (Gd-DTPA). T(2)-weighted MR images distinguished normal colon from diffusely thickened colonic wall occurring in colitis (P <0.0005) and correlated with histologic features. Values of K(trans) and v(e) obtained from dynamic contrast-enhanced MRI were also significantly different in inflamed colons compared to normal colon (P < 0.0005). The results demonstrate that both T(2)-weighted anatomic imaging and quantitative analysis of dynamic contrast-enhanced MRI data can successfully distinguish colitis from normal colon in mice.
Figures
Similar articles
-
Diffusion-weighted magnetic resonance imaging without bowel preparation for detection of ulcerative colitis.World J Gastroenterol. 2015 Sep 7;21(33):9785-92. doi: 10.3748/wjg.v21.i33.9785. World J Gastroenterol. 2015. PMID: 26361426 Free PMC article.
-
Magnetic resonance imaging of experimental mouse colitis and association with inflammatory activity.Inflamm Bowel Dis. 2006 Jun;12(6):478-85. doi: 10.1097/00054725-200606000-00006. Inflamm Bowel Dis. 2006. PMID: 16775491
-
Gadofluorine M-enhanced magnetic resonance imaging of inflammatory bowel disease: quantitative analysis and histologic correlation in a rat model.Invest Radiol. 2011 Aug;46(8):478-85. doi: 10.1097/RLI.0b013e31821459ff. Invest Radiol. 2011. PMID: 21512398
-
Intra-individual comparison of different gadolinium-based contrast agents in the quantitative evaluation of C6 glioma with dynamic contrast-enhanced magnetic resonance imaging.Sci China Life Sci. 2017 Jan;60(1):11-15. doi: 10.1007/s11427-016-0386-2. Epub 2017 Jan 4. Sci China Life Sci. 2017. PMID: 28078511
-
Dynamic contrast-enhanced MRI of prostate cancer at 3 T: a study of pharmacokinetic parameters.AJR Am J Roentgenol. 2007 Oct;189(4):849. doi: 10.2214/AJR.06.1329. AJR Am J Roentgenol. 2007. PMID: 17885055
Cited by
-
X-ray fluorescence microscopy demonstrates preferential accumulation of a vanadium-based magnetic resonance imaging contrast agent in murine colonic tumors.Mol Imaging. 2015;14:10.2310/7290.2015.00001. doi: 10.2310/7290.2015.00001. Mol Imaging. 2015. PMID: 25813904 Free PMC article.
-
Magnetic Resonance Colonography Enables the Efficacy Assessment of Immune Checkpoint Inhibitors in an Orthotopic Colorectal Cancer Mouse Model.Transl Oncol. 2019 Sep;12(9):1264-1270. doi: 10.1016/j.tranon.2019.06.006. Epub 2019 Jul 11. Transl Oncol. 2019. PMID: 31302474 Free PMC article.
-
Demonstration of a sucrose-derived contrast agent for magnetic resonance imaging of the GI tract.Bioorg Med Chem Lett. 2013 Apr 1;23(7):2061-4. doi: 10.1016/j.bmcl.2013.02.008. Epub 2013 Feb 13. Bioorg Med Chem Lett. 2013. PMID: 23481651 Free PMC article.
-
Imaging for Diagnosis and Assessment of Necrotizing Enterocolitis.Newborn (Clarksville). 2022 Jan-Mar;1(1):182-189. doi: 10.5005/jp-journals-11002-0002. Epub 2022 Mar 31. Newborn (Clarksville). 2022. PMID: 36864828 Free PMC article.
-
Application of machine learning algorithms for multiparametric MRI-based evaluation of murine colitis.PLoS One. 2018 Oct 26;13(10):e0206576. doi: 10.1371/journal.pone.0206576. eCollection 2018. PLoS One. 2018. PMID: 30365545 Free PMC article.
References
-
- Bouma G, Strober W. The immunological and genetic basis of inflammatory bowel disease. Nat Rev Immunol. 2003;3:521–533. - PubMed
-
- Gore RM, Balthazar EJ, Ghahremani GG, Miller FH. CT features of ulcerative colitis and Crohn’s disease. AJR Am J Roentgenol. 1996;167:3–15. - PubMed
-
- Thoeni RF, Cello JP. CT imaging of colitis. Radiology. 2006;240:623–638. - PubMed
-
- Pradel JA, David XR, Taourel P, Djafari M, Veyrac M, Bruel JM. Sonographic assessment of the normal and abnormal bowel wall in nondiverticular ileitis and colitis. Abdom Imaging. 1997;22:167–172. - PubMed
Publication types
MeSH terms
Substances
Grants and funding
LinkOut - more resources
Full Text Sources
Other Literature Sources
Medical
