

Renal arterial blood flow measurement by breath-held MRI: Accuracy in phantom scans and reproducibility in healthy subjects
- PMID: 20373395
- PMCID: PMC3760266
- DOI: 10.1002/mrm.22278
Renal arterial blood flow measurement by breath-held MRI: Accuracy in phantom scans and reproducibility in healthy subjects
Abstract
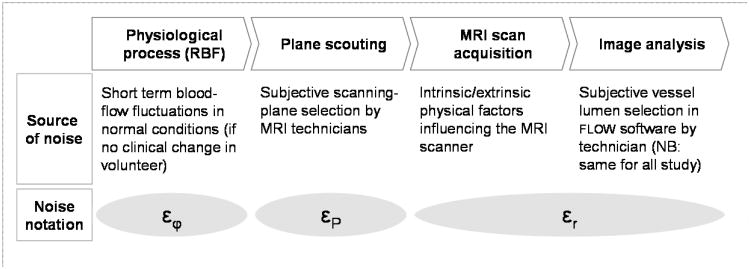
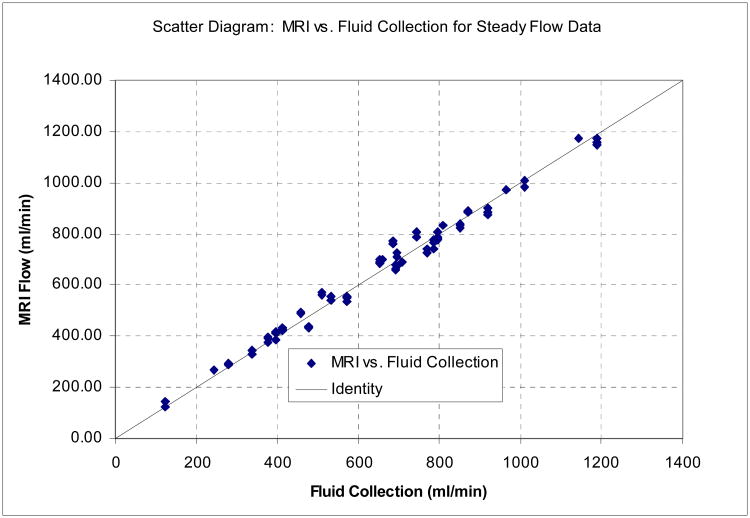
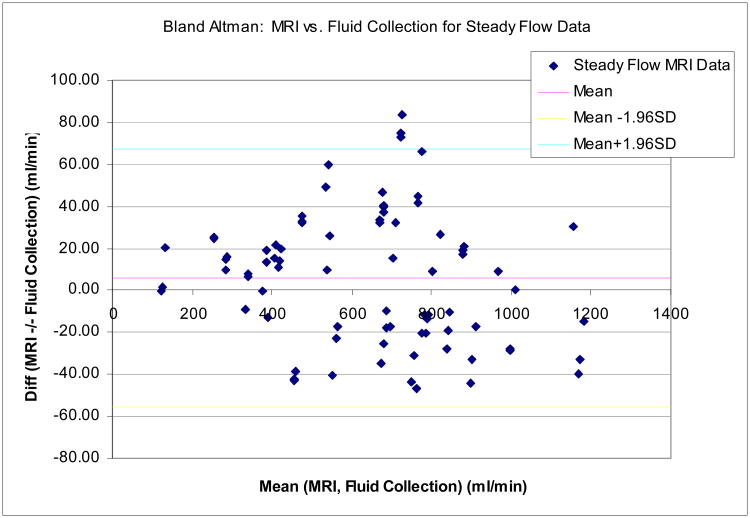
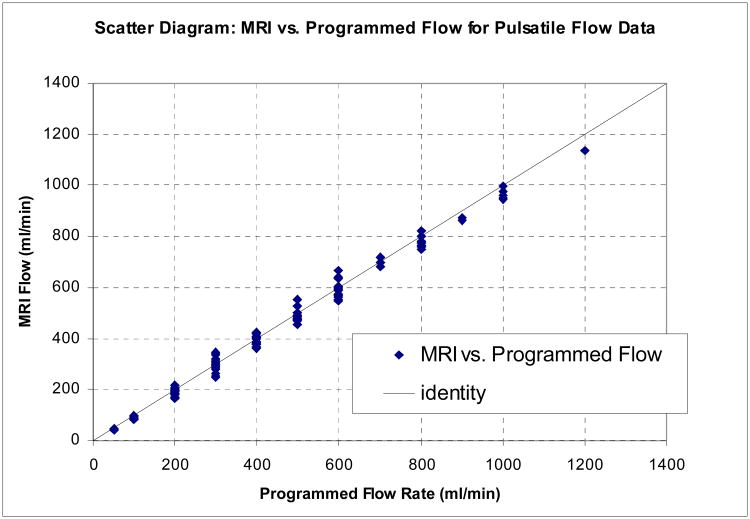
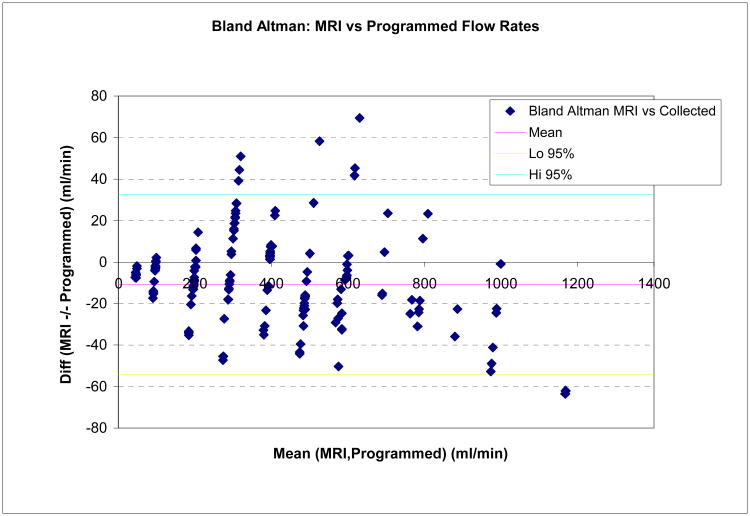
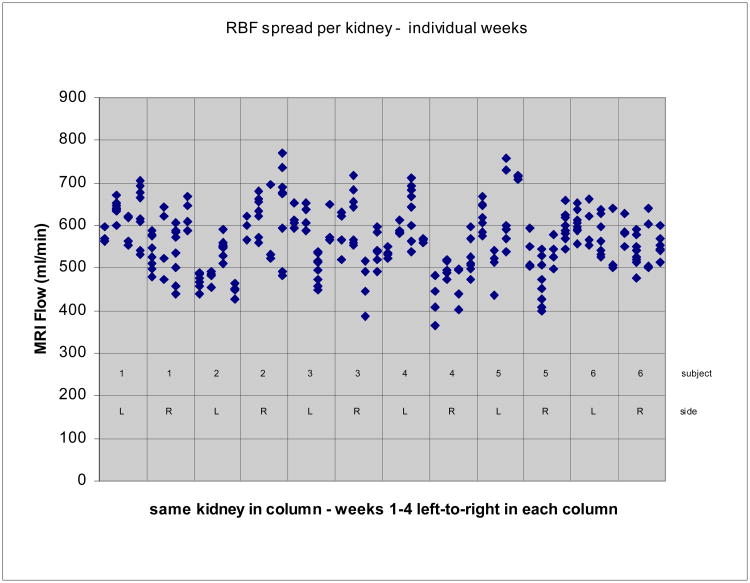
This study evaluates reliability of current technology for measurement of renal arterial blood flow by breath-held velocity-encoded MRI. Overall accuracy was determined by comparing MRI measurements with known flow in controlled-flow-loop phantom studies. Measurements using prospective and retrospective gating methods were compared in phantom studies with pulsatile flow, not revealing significant differences. Phantom study results showed good accuracy, with deviations from true flow consistently below 13% for vessel diameters 3mm and above. Reproducibility in human subjects was evaluated by repeated studies in six healthy control subjects, comparing immediate repetition of the scan, repetition of the scan plane scouting, and week-to-week variation in repeated studies. The standard deviation in the 4-week protocol of repeated in vivo measurements of single-kidney renal flow in normal subjects was 59.7 mL/min, corresponding with an average coefficient of variation of 10.55%. Comparison of renal arterial blood flow reproducibility with and without gadolinium contrast showed no significant differences in mean or standard deviation. A breakdown among error components showed corresponding marginal standard deviations (coefficients of variation) 23.8 mL/min (4.21%) for immediate repetition of the breath-held flow scan, 39.13 mL/min (6.90%) for repeated plane scouting, and 40.76 mL/min (7.20%) for weekly fluctuations in renal blood flow.
Figures
Similar articles
-
Absolute quantification of regional renal blood flow in swine by dynamic contrast-enhanced magnetic resonance imaging using a blood pool contrast agent.Invest Radiol. 2009 Mar;44(3):125-34. doi: 10.1097/RLI.0b013e318193598c. Invest Radiol. 2009. PMID: 19151609
-
Validation and reproducibility of cardiovascular 4D-flow MRI from two vendors using 2 × 2 parallel imaging acceleration in pulsatile flow phantom and in vivo with and without respiratory gating.Acta Radiol. 2019 Mar;60(3):327-337. doi: 10.1177/0284185118784981. Epub 2018 Jun 26. Acta Radiol. 2019. PMID: 30479136 Free PMC article.
-
Estimation of renal extraction fraction based on postcontrast venous and arterial differential T1 values: an error analysis.Magn Reson Med. 2005 Aug;54(2):309-16. doi: 10.1002/mrm.20548. Magn Reson Med. 2005. PMID: 16032662
-
Investigating the limitations of single breath-hold renal artery blood flow measurements using spiral phase contrast MR with R-R interval averaging.J Magn Reson Imaging. 2015 Apr;41(4):1143-9. doi: 10.1002/jmri.24638. Epub 2014 Apr 10. J Magn Reson Imaging. 2015. PMID: 24723271
-
Physiological confounders of renal blood flow measurement.MAGMA. 2024 Aug;37(4):565-582. doi: 10.1007/s10334-023-01126-7. Epub 2023 Nov 16. MAGMA. 2024. PMID: 37971557 Free PMC article. Review.
Cited by
-
Magnetic resonance imaging biomarkers for chronic kidney disease: a position paper from the European Cooperation in Science and Technology Action PARENCHIMA.Nephrol Dial Transplant. 2018 Sep 1;33(suppl_2):ii4-ii14. doi: 10.1093/ndt/gfy152. Nephrol Dial Transplant. 2018. PMID: 30137584 Free PMC article.
-
Feasibility of measuring renal blood flow by phase-contrast magnetic resonance imaging in patients with autosomal dominant polycystic kidney disease.Eur Radiol. 2016 Mar;26(3):683-92. doi: 10.1007/s00330-015-3877-y. Epub 2015 Jul 11. Eur Radiol. 2016. PMID: 26162576 Free PMC article.
-
Phase-contrast magnetic resonance imaging to assess renal perfusion: a systematic review and statement paper.MAGMA. 2020 Feb;33(1):3-21. doi: 10.1007/s10334-019-00772-0. Epub 2019 Aug 17. MAGMA. 2020. PMID: 31422518 Free PMC article.
-
Effect of MRI acquisition parameters on accuracy and precision of phase-contrast measurements in a small-lumen vessel phantom.Eur Radiol Exp. 2024 Mar 13;8(1):45. doi: 10.1186/s41747-024-00435-3. Eur Radiol Exp. 2024. PMID: 38472565 Free PMC article.
-
Inter-study reproducibility of interleaved spiral phase velocity mapping of renal artery haemodynamics.J Cardiovasc Magn Reson. 2015 Feb 4;17(1):8. doi: 10.1186/s12968-014-0105-x. J Cardiovasc Magn Reson. 2015. PMID: 25648103 Free PMC article.
References
-
- Schoenberg SO, Knopp MV, Bock M, Kallinowski F, Just A, Essig M, Hawighorst H, Schad L, van Kaick G. Renal Artery Stenosis: Grading of Hemodynamic Changes with Cine Phase-Contrast MR Blood Flow Measurements. Radiology. 1997;203:45–53. - PubMed
-
- King BF, Torres VE, Brummer ME, Chapman AB, Bae KT, Glockner JF, Arya K, Felmlee JP, Grantham JJ, Guay-Woodford LM, Bennett WM, Klahr S, Hirschman GH, Kimmel PL, Thompson PA, Miller JP, the Consortium for Radiologic Imaging Studies of Polycystic Kidney Disease (CRISP) Magnetic Resonance Measurements of Renal Blood Flow as a Marker of Disease Severity in Autosomal Dominant Polycystic Kidney Disease. Kidney Int. 2003;64(6):2214–21. - PubMed
-
- Van Dijk P. Direct cardiac NMR imaging of heart wall and blood flow velocity. J Comput Assist Tomogr. 1984;8(3):429–36. - PubMed
-
- Bryant DJ, Payne JA, Firmin DN, Longmore DB. Measurement of Flow with NMR Imaging Using a Gradient Pulse and Phase Difference Technique. J Comput Assist Tomogr. 1984;8(4):588–593. - PubMed
-
- Axel L. Blood Flow Effects in Magnetic Resonance Imaging. Am J Roentgenol. 1984;143:1157–1166. - PubMed
Publication types
MeSH terms
Substances
Grants and funding
LinkOut - more resources
Full Text Sources
Medical
