. 2010 Apr;23(2):135-49.
doi: 10.1089/vim.2009.0088.

Porcine small intestinal epithelial cell line (IPEC-J2) of rotavirus infection as a new model for the study of innate immune responses to rotaviruses and probiotics

Affiliations

Porcine small intestinal epithelial cell line (IPEC-J2) of rotavirus infection as a new model for the study of innate immune responses to rotaviruses and probiotics

Fangning Liu et al. Viral Immunol. 2010 Apr.

Abstract

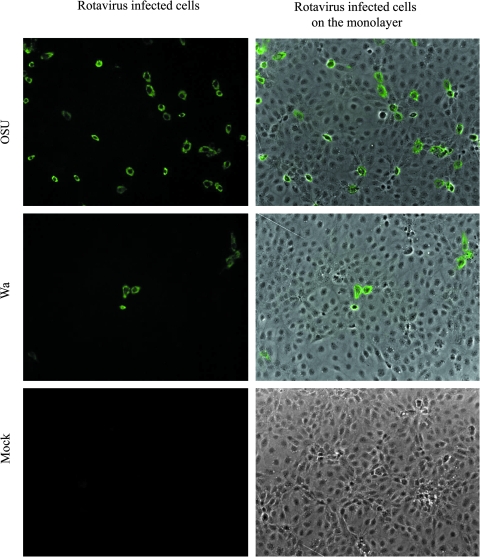
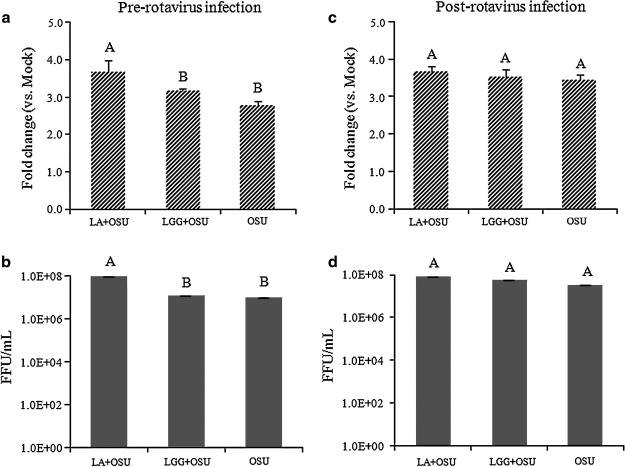
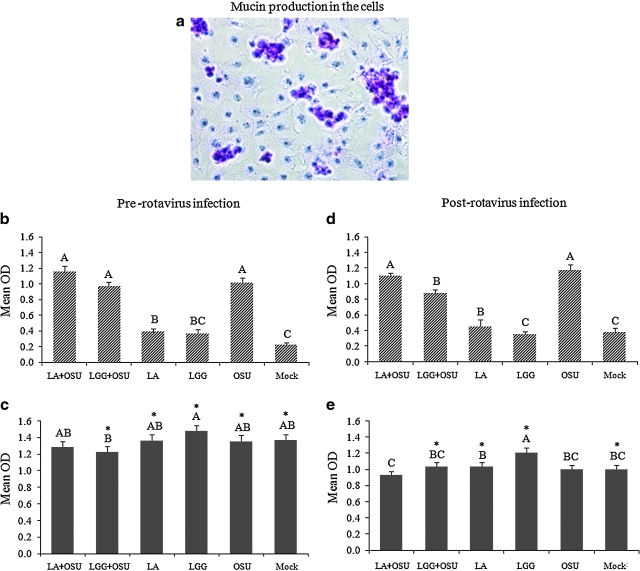
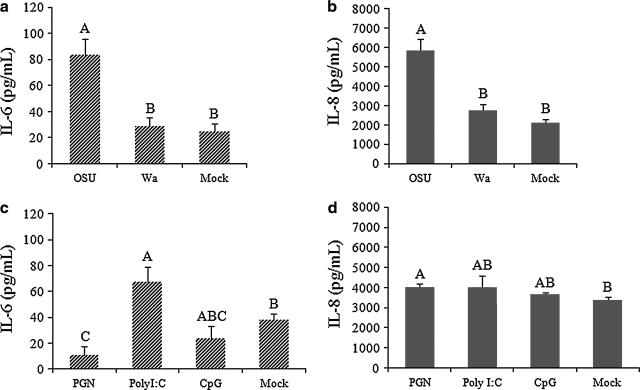
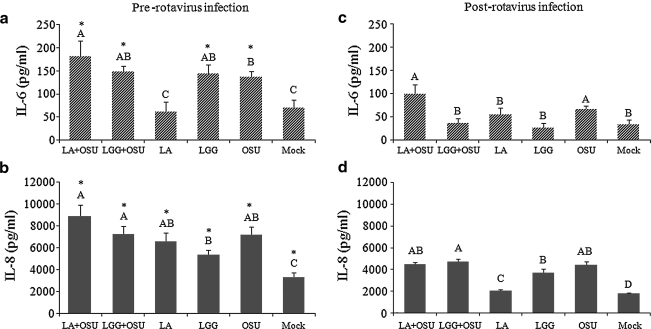
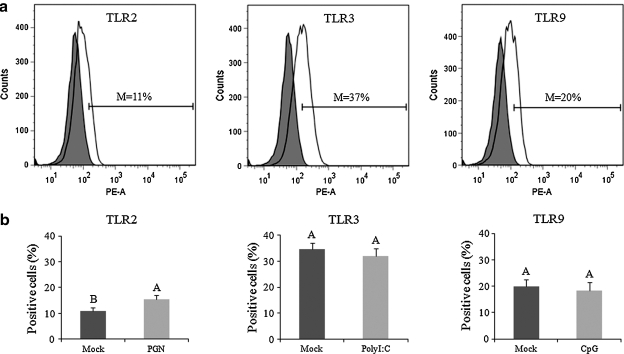
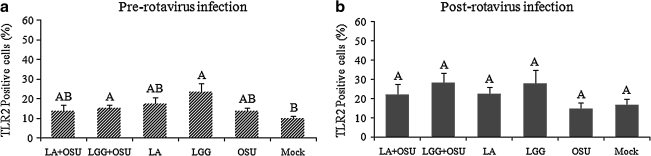
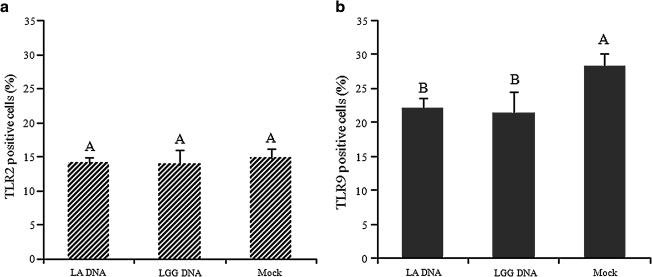
Previous studies of epithelial immune responses to rotavirus infection have been conducted in transformed cell lines. In this study, we evaluated a non-transformed porcine jejunum epithelial cell line (IPEC-J2) as an in-vitro model of rotavirus infection and probiotic treatment. Cell-culture-adapted porcine rotavirus (PRV) OSU strain, or human rotavirus (HRV) Wa strain, along with Lactobacillus acidophilus (LA) or Lactobacillus rhamnosus GG (LGG) were used to inoculate IPEC-J2 cells. LA or LGG treatment was applied pre- or post-rotavirus infection. We demonstrated that IPEC-J2 cells were productively infected by PRV. LA or LGG treatment of the cells did not reduce virus replication. PRV infection increased MUC3 mucin secretion. LGG treatment post-rotavirus infection reduced the mucin secretion response induced by PRV; LGG alone increased the production of membrane-associated MUC3 mucin. LA treatment prior to rotavirus infection significantly increased PRV replication and the IL-6 response to PRV infection, which is consistent with the adjuvant effect of LA. LGG treatment post-rotavirus infection downregulated the IL-6 response, confirming the anti-inflammatory effect of LGG. IPEC-J2 cells expressed toll-like receptor (TLR) 2, TLR3, and TLR9 constitutively. TLR2 expression was upregulated by LGG and peptidoglycan, corresponding to the decreased IL-6 response, indicating that the protective effect of LGG is associated with upregulation of TLR2 expression on intestinal epithelial cells. The IPEC-J2 cell model of PRV infection is a completely homologous system. It is a valuable model for studying the interactions among rotavirus-host-probiotics, and the mechanisms behind the immunomodulating effect of probiotic bacteria on innate immune responses.


Figures

FIG. 1.
FIG. 1.
Rotavirus infection of IPEC-J2 cells. IPEC-J2 cells were infected with 20 MOI rotavirus for 24 h, and were then processed for immunofluorescence staining. Images are representative of three independent experiments (original magnification 100 ×). (Color image is available online at www.liebertonline.com/vim.)
FIG. 2.
FIG. 2.
The effect of probiotics on rotavirus infectivity in the IPEC-J2 cells. The cells were infected with OSU PRV and treated with the probiotics LA or LGG using the two protocols described in the materials and methods section. Rotavirus antigens in the supernatants were measured by ELISA, and the mean fold-increases in OD values of the treatment groups over the mock group are presented in the upper panels (a and c). The virus titers in the supernatants as measured by CCIF are presented as mean FFU/mL in panels b and d. Means were calculated from four to six independent experiments. Error bars indicate the standard error of the mean. The capital letters (A and B) indicate the results of significance testing for the difference between treatments. Unshared letters indicate significant difference between treatment groups (Kruskal-Wallis rank sum test, p < 0.05), while shared letters indicate no significant difference (LA+OSU, Lactobacillus acidophilus + OSU PRV; LGG+OSU, Lactobacillus rhamnosus + OSU PRV; OSU, OSU PRV alone).
FIG. 3.
FIG. 3.
Mucin production and the effect of LA and LGG on MUC3 mucin production in IPEC-J2 cells. (a) Mucin production (purple clusters) in IPEC-J2 cells was detected by PAS staining (original magnification 200 ×). (b and d) MUC3 mucin concentrations in the supernatants (secreted mucin), and (c and e) frozen and thawed cells along with the supernatants (total mucin) were measured by ELISA. Mean ELISA OD values of 5–10 independent experiments for each treatment group are presented. Error bars indicate the standard error of the mean. The capital letters (A, B, C) indicate the results of significance testing for the difference between treatments. Unshared letters indicate significant difference between treatment groups (Kruskal-Wallis rank sum test, p < 0.05), while shared letters indicate no significant difference Asterisks indicate significant difference between secreted and total mucin concentrations. (LA+OSU, Lactobacillus acidophilus + OSU PRV; LGG+OSU, Lactobacillus rhamnosus + OSU PRV; OSU, OSU PRV alone; Mock, mock infected). (Color image is available online at www.liebertonline.com/vim.)
FIG. 4.
FIG. 4.
IL-6 and IL-8 responses in IPEC-J2 cells infected with rotavirus, or stimulated with PGN, polyI:C, or CpG. Concentrations of IL-6 and IL-8 in the cell supernatants were detected by ELISA. Mean cytokine concentrations from several independent experiments are presented (n = 14 in a and b; n = 4 in c and d). Error bars indicate the standard error of the mean. The capital letters (A, B, C) indicate the results of significance testing for the difference between treatments. Unshared letters indicate significant difference between treatment groups (Kruskal-Wallis rank sum test, p < 0.05), while shared letters indicate no significant difference.
FIG. 5.
FIG. 5.
The effect of LA and LGG on IL-6 and IL-8 responses in IPEC-J2 cells. Mean cytokine concentrations of 6–10 independent experiments are presented. Error bars indicate the standard error of the mean. The capital letters (A, B, C, D) indicate the results of significance testing for the difference between treatments. Unshared letters indicate significant difference between treatment groups (Kruskal-Wallis rank sum test, p < 0.05), while shared letters indicate no significant difference. (LA+OSU, Lactobacillus acidophilus + OSU PRV; LGG+OSU, Lactobacillus rhamnosus + OSU PRV; LA, LA alone; LGG, LGG alone; OSU, OSU PRV alone; Mock, mock infected). Asterisks indicate significant difference between pre- and post-rotavirus infection.
FIG. 6.
FIG. 6.
TLR2, TLR3, and TLR9 expression on IPEC-J2 cells. The PGN-, polyI:C-, or CpG-stimulated or mock-stimulated cells were labeled with TLR2, TLR3, or TLR9 antibodies, respectively (white histograms in a), and assayed by flow cytometry. Cells labeled with isotype-matched irrelevant antibodies served as background controls (shaded histograms in a). Histogram plots were generated by gating on live single cells. Data presented in a and b are the means of percentages of TLR-positive cells minus the percentages of non-specific staining in isotype-matched background controls. The histograms in 6a are representative of 9–10 independent experiments; 6b presents the means of 9–10 independent experiments. Error bars indicate the standard error of the mean. The capital letters (A and B) indicate the results of significance testing for the difference between treatments. Unshared letters indicate significant difference between treatment groups (Kruskal-Wallis rank sum test, p < 0.05), while shared letters indicate no significant difference (M, mean frequencies).
FIG. 7.
FIG. 7.
The effect of probiotics on TLR2 expression by IPEC-J2 cells. Mean frequencies of each treatment group from 5–10 independent experiments are presented. Error bars indicate the standard error of the mean. The capital letters (A and B) indicate the results of significance testing for the difference between treatments. Unshared letters indicate significant difference between treatment groups (Kruskal-Wallis rank sum test, p < 0.05), while shared letters indicate no significant difference (LA+OSU, Lactobacillus acidophilus + OSU PRV; LGG+OSU, Lactobacillus rhamnosus + OSU PRV; LA, LA alone; LGG, LGG alone; OSU, OSU PRV alone; Mock, mock infected).
FIG. 8.
FIG. 8.
The effect of probiotic genome DNA on TLR2 and TLR9 expression by IPEC-J2 cells. The cells stimulated or mock-stimulated with total DNA from LA or LGG were collected for detection of TLR2 and TLR9 expression by flow cytometry. Fig. 8a presents the mean of three independent experiments, and Fig. 8b presents the mean of six independent experiments. Error bars indicate the standard error of the mean. The capital letters (A and B) indicate the results of significance testing for the difference between treatments. Unshared letters indicate significant difference between treatment groups (Kruskal-Wallis rank sum test, p < 0.05), while shared letters indicate no significant difference.

Comment in

Similar articles

Cited by

References

    1. Arce C. Ramirez-Boo M. Lucena C. Garrido JJ. Innate immune activation of swine intestinal epithelial cell lines (IPEC-J2, IPI-2I) in response to LPS from Salmonella typhimurium. Comp Immunol Microbiol Infect Dis. doi: 10.1016/j.cimid.2008.1008.1003. - PubMed
    1. Azevedo MS. Yuan L. Pouly S. Gonzales AM. Jeong KI. Nguyen TV. Saif LJ. Cytokine responses in gnotobiotic pigs after infection with virulent or attenuated human rotavirus. J Virol. 2006;80:372–382. - PMC - PubMed
    1. Azim T. Zaki MH. Podder G, et al. Rotavirus-specific subclass antibody and cytokine responses in Bangladeshi children with rotavirus diarrhoea. J Med Virol. 2003;69:286–295. - PubMed
    1. Bohl EH. Theil KW. Saif LJ. Isolation and serotyping of porcine rotaviruses and antigenic comparison with other rotaviruses. J Clin Microbiol. 1984;19:105–111. - PMC - PubMed
    1. Borchers AT. Selmi C. Meyers FJ. Keen CL. Gershwin ME. Probiotics and immunity. J Gastroenterol. 2009;44:26–46. - PubMed

Publication types