

Regional differences in nerve terminal Na+ channel subtype expression and Na+ channel-dependent glutamate and GABA release in rat CNS
- PMID: 20374421
- PMCID: PMC2914626
- DOI: 10.1111/j.1471-4159.2010.06722.x
Regional differences in nerve terminal Na+ channel subtype expression and Na+ channel-dependent glutamate and GABA release in rat CNS
Abstract
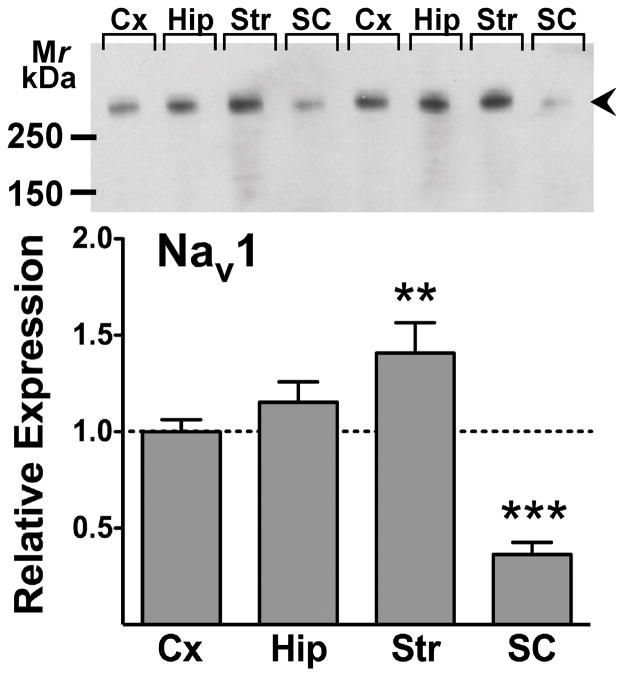
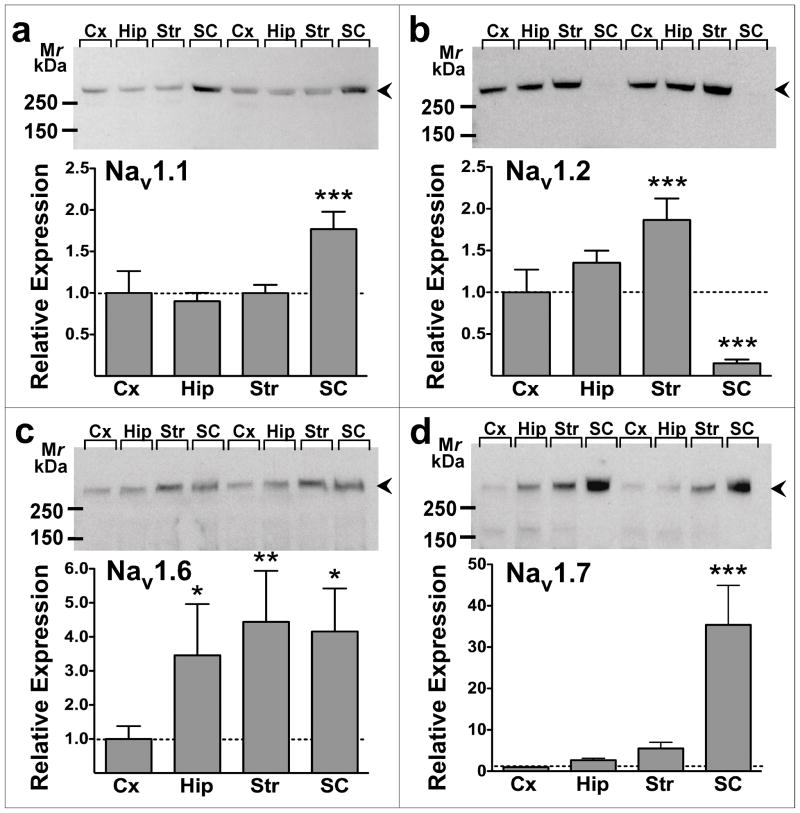
We tested the hypothesis that expression of pre-synaptic voltage-gated sodium channel (Na(v)) subtypes coupled to neurotransmitter release differs between transmitter types and CNS regions in a nerve terminal-specific manner. Na(v) coupling to transmitter release was determined by measuring the sensitivity of 4-aminopyridine (4AP)-evoked [(3)H]glutamate and [(14)C]GABA release to the specific Na(v) blocker tetrodotoxin (TTX) for nerve terminals isolated from rat cerebral cortex, hippocampus, striatum and spinal cord. Expression of various Na(v) subtypes was measured by immunoblotting using subtype-specific antibodies. Potencies of TTX for inhibition of glutamate and GABA release varied between CNS regions. However, the efficacies of TTX for inhibition of 4AP-evoked glutamate release were greater than for inhibition of GABA release in all regions except spinal cord. The relative nerve terminal expression of total Na(v) subtypes as well as of specific subtypes varied considerably between CNS regions. The region-specific potencies of TTX for inhibition of 4AP-evoked glutamate release correlated with greater relative expression of total nerve terminal Na(v) and Na(v)1.2. Nerve terminal-specific differences in the expression of specific Na(v) subtypes contribute to transmitter-specific and regional differences in pharmacological sensitivities of transmitter release.
Figures


Similar articles
-
Regional differences in the effects of isoflurane on neurotransmitter release.Neuropharmacology. 2011 Sep;61(4):699-706. doi: 10.1016/j.neuropharm.2011.05.013. Epub 2011 May 30. Neuropharmacology. 2011. PMID: 21651920 Free PMC article.
-
Presynaptic inhibition of the release of multiple major central nervous system neurotransmitter types by the inhaled anaesthetic isoflurane.Br J Anaesth. 2013 Apr;110(4):592-9. doi: 10.1093/bja/aes448. Epub 2012 Dec 4. Br J Anaesth. 2013. PMID: 23213036 Free PMC article.
-
Volatile anesthetic effects on glutamate versus GABA release from isolated rat cortical nerve terminals: 4-aminopyridine-evoked release.J Pharmacol Exp Ther. 2006 Jan;316(1):216-23. doi: 10.1124/jpet.105.090662. Epub 2005 Sep 20. J Pharmacol Exp Ther. 2006. PMID: 16174800
-
Selective depression by general anesthetics of glutamate versus GABA release from isolated cortical nerve terminals.J Pharmacol Exp Ther. 2003 Mar;304(3):1188-96. doi: 10.1124/jpet.102.044685. J Pharmacol Exp Ther. 2003. PMID: 12604696
-
Neuroprotective use-dependent blockers of Na+ and Ca2+ channels controlling presynaptic release of glutamate.Ann N Y Acad Sci. 1995 Sep 15;765:210-29. doi: 10.1111/j.1749-6632.1995.tb16578.x. Ann N Y Acad Sci. 1995. PMID: 7486608 Review.
Cited by
-
Activity-dependent depression of neuronal sodium channels by the general anaesthetic isoflurane.Br J Anaesth. 2015 Jul;115(1):112-21. doi: 10.1093/bja/aev203. Br J Anaesth. 2015. PMID: 26089447 Free PMC article.
-
Sodium channels as targets for volatile anesthetics.Front Pharmacol. 2012 Mar 30;3:50. doi: 10.3389/fphar.2012.00050. eCollection 2012. Front Pharmacol. 2012. PMID: 22479247 Free PMC article.
-
Differential Inhibition of Neuronal Sodium Channel Subtypes by the General Anesthetic Isoflurane.J Pharmacol Exp Ther. 2019 May;369(2):200-211. doi: 10.1124/jpet.118.254938. Epub 2019 Feb 21. J Pharmacol Exp Ther. 2019. PMID: 30792243 Free PMC article.
-
Regional differences in the effects of isoflurane on neurotransmitter release.Neuropharmacology. 2011 Sep;61(4):699-706. doi: 10.1016/j.neuropharm.2011.05.013. Epub 2011 May 30. Neuropharmacology. 2011. PMID: 21651920 Free PMC article.
-
Presynaptic inhibition of the release of multiple major central nervous system neurotransmitter types by the inhaled anaesthetic isoflurane.Br J Anaesth. 2013 Apr;110(4):592-9. doi: 10.1093/bja/aes448. Epub 2012 Dec 4. Br J Anaesth. 2013. PMID: 23213036 Free PMC article.
References
-
- Black JA, Yokoyama S, Higashida H, Ransom BR, Waxman SG. Sodium channel mRNAs I, II and III in the CNS: cell-specific expression. Brain Res Mol Brain Res. 1994;22:275–289. - PubMed
-
- Bowman D, Alexander S, Lodge D. Pharmacological characterisation of the calcium channels coupled to the plateau phase of KCl-induced intracellular free Ca2+ elevation in chicken and rat synaptosomes. Neuropharmacology. 1993;32:1195–1202. - PubMed
-
- Bradford MM. A rapid and sensitive method for the quantitation of microgram quantities of protein utilizing the principle of protein-dye binding. Anal Biochem. 1976;72:248–254. - PubMed
Publication types
MeSH terms
Substances
Grants and funding
LinkOut - more resources
Full Text Sources
