

Evaluation design of a systematic, selective, internet-based, Chlamydia screening implementation in the Netherlands, 2008-2010: implications of first results for the analysis
- PMID: 20374635
- PMCID: PMC2858140
- DOI: 10.1186/1471-2334-10-89
Evaluation design of a systematic, selective, internet-based, Chlamydia screening implementation in the Netherlands, 2008-2010: implications of first results for the analysis
Abstract
Background: A selective, systematic, Internet-based, Chlamydia Screening Implementation for 16 to 29-year-old residents started in three regions in the Netherlands in April 2008: in the cities of Amsterdam and Rotterdam and a more rural region, South Limburg. This paper describes the evaluation design and discusses the implications of the findings from the first screening round for the analysis. The evaluation aims to determine the effects of screening on the population prevalence of Chlamydia trachomatis after multiple screening rounds.
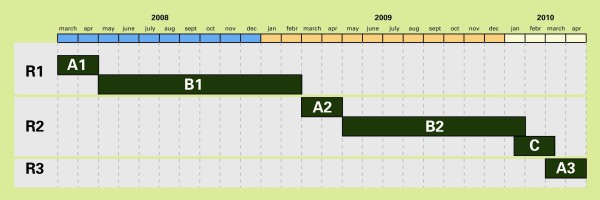
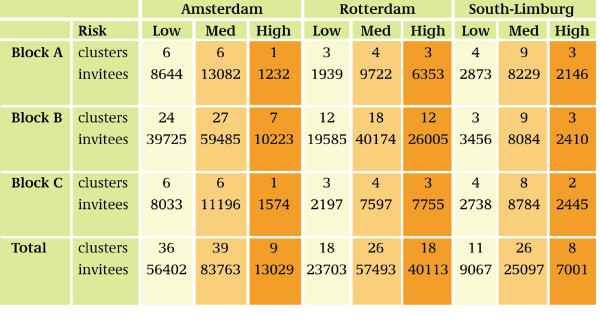
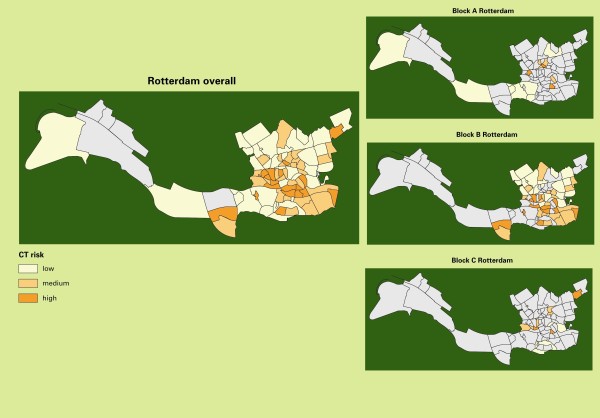
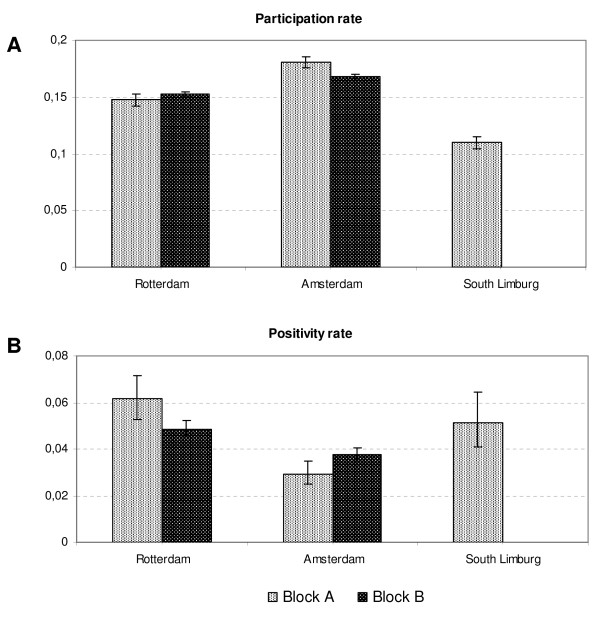
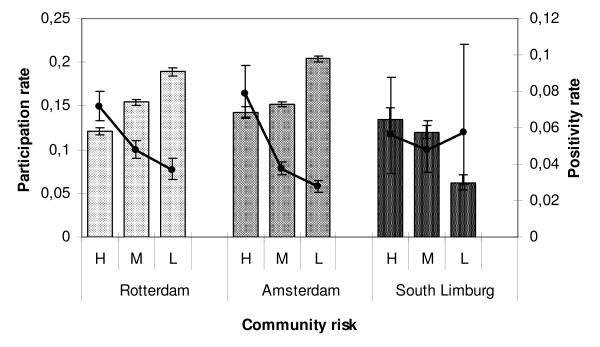
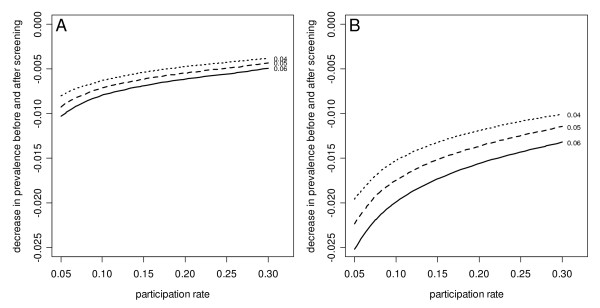
Methods: A phased implementation or 'stepped wedge design' was applied by grouping neighbourhoods (hereafter: clusters) into three random, risk-stratified blocks (A, B and C) to allow for impact analyses over time and comparison of prevalences before and after one or two screening rounds. Repeated simulation of pre- and postscreening Chlamydia prevalences was used to predict the minimum detectable decline in prevalence. Real participation and positivity rates per region, block, and risk stratum (high, medium, and low community risk) from the 1st year of screening were used to substantiate predictions.
Results: The results of the 1st year show an overall participation rate of 16% of 261,025 invitees and a positivity rate of 4.2%, with significant differences between regions and blocks. Prediction by simulation methods adjusted with the first-round results indicate that the effect of screening (minimal detectable difference in prevalence) may reach significance levels only if at least a 15% decrease in the Chlamydia positivity rate in the cities and a 25% decrease in the rural region after screening can be reached, and pre- and postscreening differences between blocks need to be larger.
Conclusions: With the current participation rates, the minimal detectable decline of Chlamydia prevalence may reach our defined significance levels at the regional level after the second screening round, but will probably not be significant between blocks of the stepped wedge design. Evaluation will also include other aspects and prediction models to obtain rational advice about future Chlamydia screening in the Netherlands.
Figures

References
Publication types
MeSH terms
LinkOut - more resources
Full Text Sources
Other Literature Sources
Medical
Miscellaneous
