. 2010 Apr 7;2(4):23.
doi: 10.1186/gm144.

Investigation of post-transcriptional gene regulatory networks associated with autism spectrum disorders by microRNA expression profiling of lymphoblastoid cell lines

Affiliations

Investigation of post-transcriptional gene regulatory networks associated with autism spectrum disorders by microRNA expression profiling of lymphoblastoid cell lines

Tewarit Sarachana et al. Genome Med. .

Abstract

Background: Autism spectrum disorders (ASD) are neurodevelopmental disorders characterized by abnormalities in reciprocal social interactions and language development and/or usage, and by restricted interests and repetitive behaviors. Differential gene expression of neurologically relevant genes in lymphoblastoid cell lines from monozygotic twins discordant in diagnosis or severity of autism suggested that epigenetic factors such as DNA methylation or microRNAs (miRNAs) may be involved in ASD.

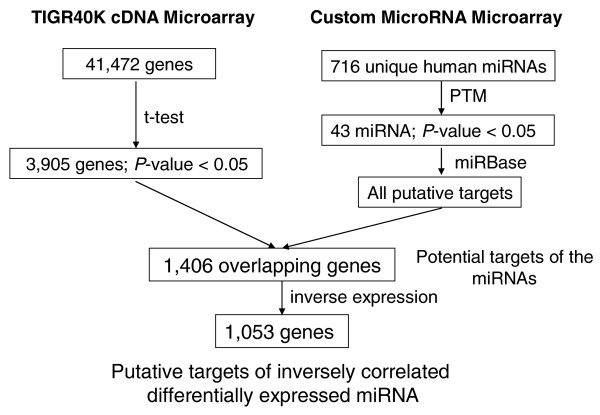
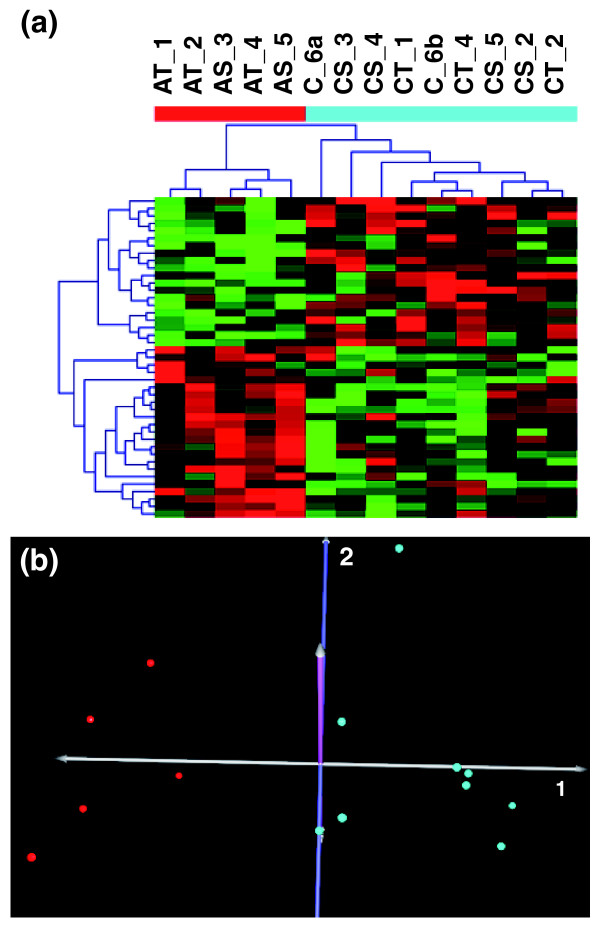
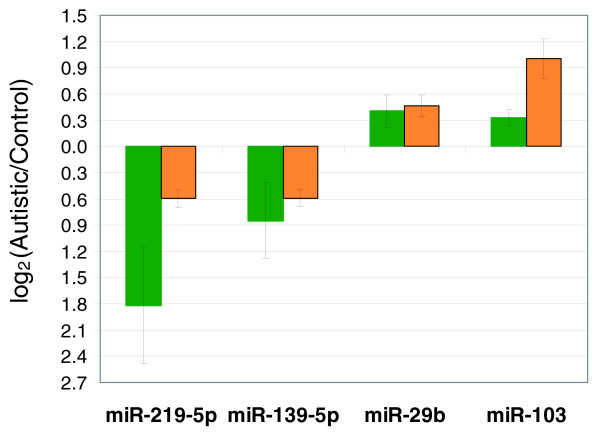
Methods: Global miRNA expression profiling using lymphoblasts derived from these autistic twins and unaffected sibling controls was therefore performed using high-throughput miRNA microarray analysis. Selected differentially expressed miRNAs were confirmed by quantitative reverse transcription-polymerase chain reaction (qRT-PCR) analysis, and the putative target genes of two of the confirmed miRNA were validated by knockdown and overexpression of the respective miRNAs.

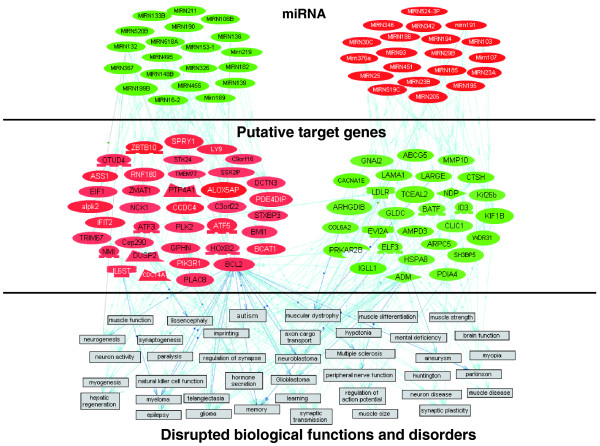
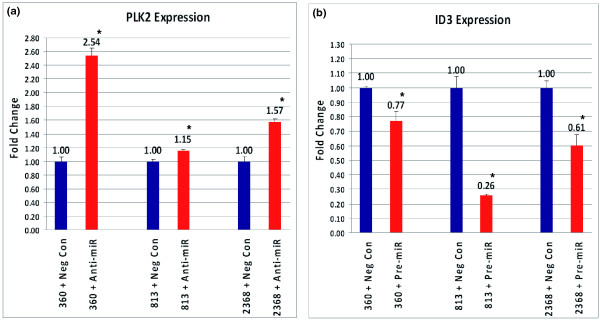
Results: Differentially expressed miRNAs were found to target genes highly involved in neurological functions and disorders in addition to genes involved in gastrointestinal diseases, circadian rhythm signaling, as well as steroid hormone metabolism and receptor signaling. Novel network analyses of the putative target genes that were inversely expressed relative to the relevant miRNA in these same samples further revealed an association with ASD and other co-morbid disorders, including muscle and gastrointestinal diseases, as well as with biological functions implicated in ASD, such as memory and synaptic plasticity. Putative gene targets (ID3 and PLK2) of two RT-PCR-confirmed brain-specific miRNAs (hsa-miR-29b and hsa-miR-219-5p) were validated by miRNA overexpression or knockdown assays, respectively. Comparisons of these mRNA and miRNA expression levels between discordant twins and between case-control sib pairs show an inverse relationship, further suggesting that ID3 and PLK2 are in vivo targets of the respective miRNA. Interestingly, the up-regulation of miR-23a and down-regulation of miR-106b in this study reflected miRNA changes previously reported in post-mortem autistic cerebellum by Abu-Elneel et al. in 2008. This finding validates these differentially expressed miRNAs in neurological tissue from a different cohort as well as supports the use of the lymphoblasts as a surrogate to study miRNA expression in ASD.

Conclusions: Findings from this study strongly suggest that dysregulation of miRNA expression contributes to the observed alterations in gene expression and, in turn, may lead to the pathophysiological conditions underlying autism.


Figures

Figure 1
Figure 1
Schematic flow diagram describing procedures used to identify inversely correlated differentially expressed putatitve target genes of the differentially expressed miRNAs. Tens of thousands of putative target genes are associated with the 43 differentially expressed miRNAs, some of which are overlapping between different miRNAs. For the correlation analyses, we used all of the putative target genes.
Figure 2
Figure 2
Hierarchical cluster analysis and principal component analysis of significantly differentially expressed miRNAs from the Pavlidis template matching analysis. (a) Unsupervised hierarchical cluster analysis of 43 significantly differentially expressed miRNAs between all autistic individuals (red bar) and controls (turquoise bar) shows the distinct miRNA expression pattern of the two groups (P < 0.05). The individual samples are coded as follows: AT, autistic twin; AS, autistic sibling; CT, control, undiagnosed twin; CS, control, nonautistic sibling; C_6a/b, nonautistic, monozygotic twins a and b. The same numbers following the sample descriptors indicate members of the same family. (b) Principal component analysis of the samples based on the same set of miRNAs reduces the dimensionality of the data and shows the clear separation between the autistic individuals (red) and the controls (turquoise).
Figure 3
Figure 3
Results of TaqMan miRNA qRT-PCR analyses of four brain-associated miRNAs (hsa-miR-219-5p, hsa-miR-139-5p, hsa-miR-29b, and hsa-miR-103) in autistic and control lymphoblastoid cell lines. Expression levels of selected miRNAs associated with brain development from TaqMan qRT-PCR analyses confirm data obtained by miRNA microarrays. Green bars, qRT-PCR data; orange bars, DNA microarray data. Error bars represent standard errors associated with miRNA Taqman qRT-PCR or miRNA microarray analyses (hsa-miR-219-5p/hsa-miR-29b/hsa-miR-103, n = 5 case-control pairs; hsa-miR-139-5p, n = 4 pairs).
Figure 4
Figure 4
Relationships between differentially expressed miRNAs, putative target genes, and functions. Network and pathway analysis using Pathway Studio 5 shows the relationships among the significantly differentially expressed miRNAs, potential target genes (expression cutoff log2 ratio ≥± 0.4), and biological functions and disorders implicated by the differentially expressed target genes. Up-regulated genes and miRNAs are in red; down-regulated genes and miRNAs are in green.
Figure 5
Figure 5
Validation of miRNA targets. Three LCLs from non-autistic individuals were transfected with hsa-miR-29b pre-miR precursor, hsa-miR-219b anti-miR inhibitor, pre-miR negative control, or anti-miR negative control. At 72 hours after transfection, qRT-PCR analyses were conducted to determine expression of PLK2 and ID3 genes in the pre-miR/anti-miR-transfected LCLs (red), compared to respective pre-miR/anti-miR negative controls (navy). (a, b) Expression of PLK2 was significantly increased in the LCLs transfected with anti-miR-219-5p (a), whereas ID3 expression was significantly decreased in pre-miR-29b-transfected LCLs (b). The error bars show the standard error among the technical replicates. *P < 0.05.

References

    1. Volkmar F, Chawarska K, Klin A. Autism in infancy and early childhood. Annu Rev Psychol. 2005;56:315–336. doi: 10.1146/annurev.psych.56.091103.070159. - DOI - PubMed
    1. Barton M, Volkmar F. How commonly are known medical conditions associated with autism? J Autism Dev Disord. 1998;28:273–278. doi: 10.1023/A:1026052417561. - DOI - PubMed
    1. Rutter M, Bailey A, Bolton P, Le Couteur A. Autism and known medical conditions: myth and substance. J Child Psychol Psychiatry. 1994;35:311–322. doi: 10.1111/j.1469-7610.1994.tb01164.x. - DOI - PubMed
    1. Volkmar FR, Lord C, Bailey A, Schultz RT, Klin A. Autism and pervasive developmental disorders. J Child Psychol Psychiatry. 2004;45:135–170. doi: 10.1046/j.0021-9630.2003.00317.x. - DOI - PubMed
    1. International Molecular Genetic Study of Autism Consortium (IMGSAC) A genomewide screen for autism: strong evidence for linkage to chromosomes 2q, 7q, and 16p. Am J Hum Genet. 2001;69:570–581. doi: 10.1086/323264. - DOI - PMC - PubMed