. 2010 Apr 7;11(4):286-97.
doi: 10.1016/j.cmet.2010.03.002.

Direct insulin and leptin action on pro-opiomelanocortin neurons is required for normal glucose homeostasis and fertility

Affiliations

Direct insulin and leptin action on pro-opiomelanocortin neurons is required for normal glucose homeostasis and fertility

Jennifer W Hill et al. Cell Metab. .

Abstract

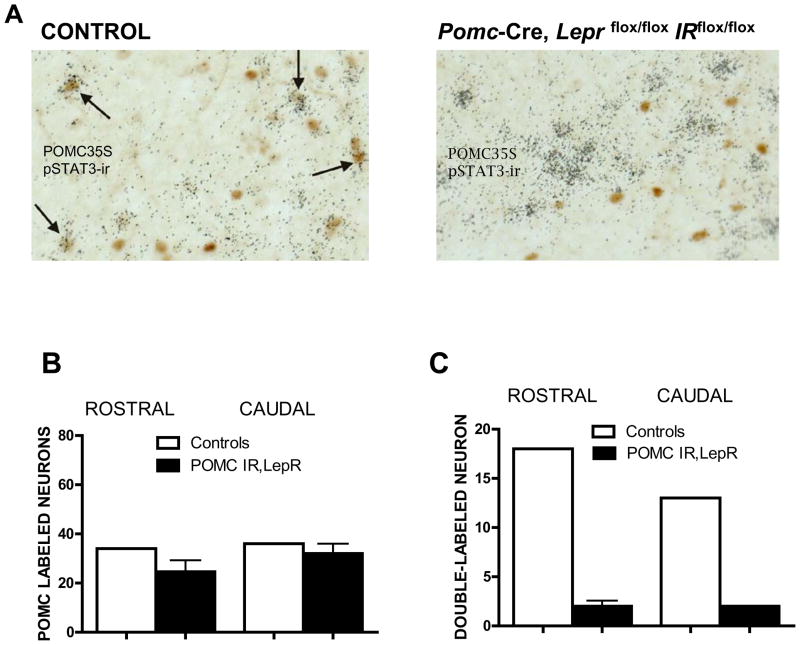
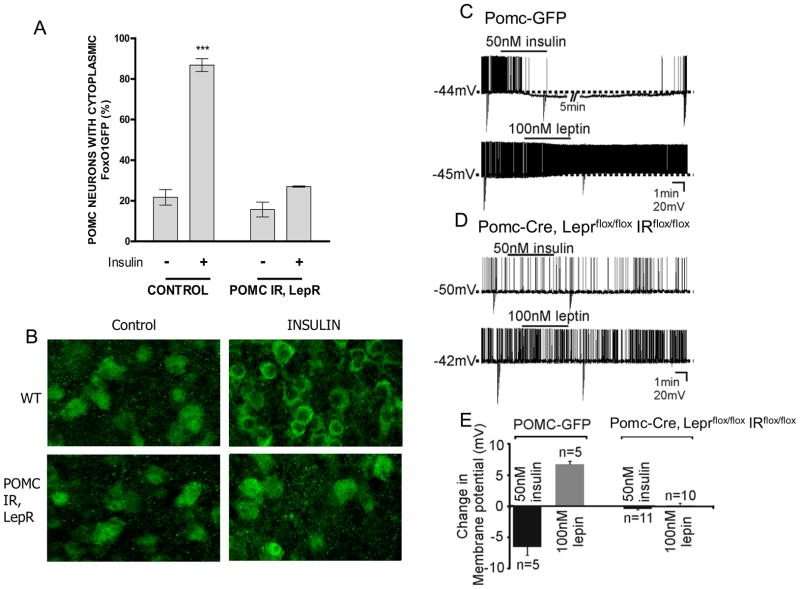
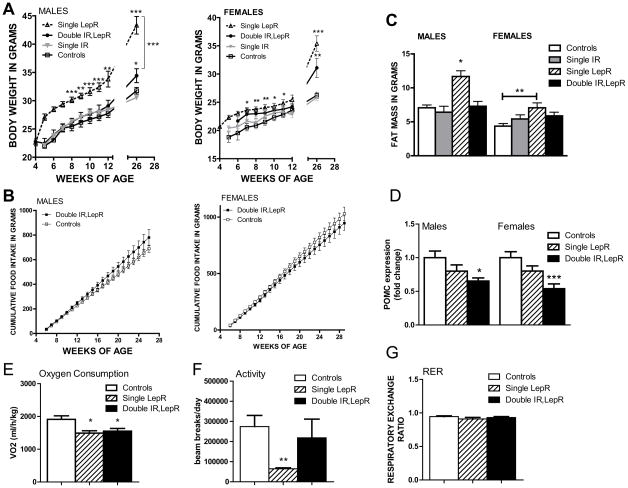
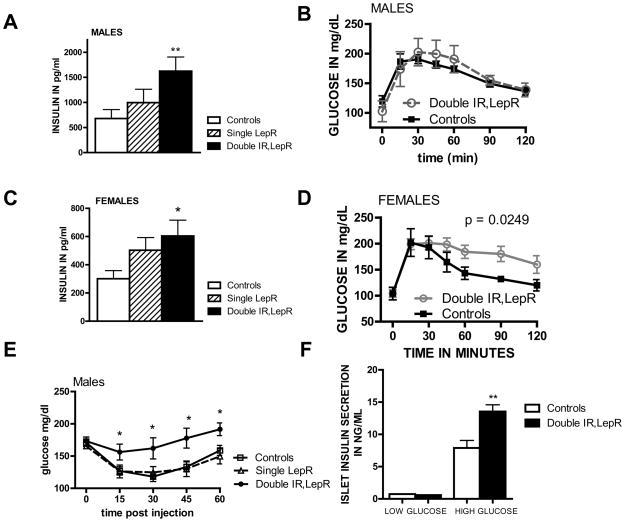
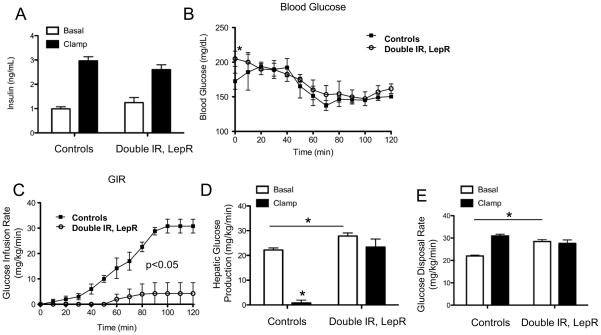
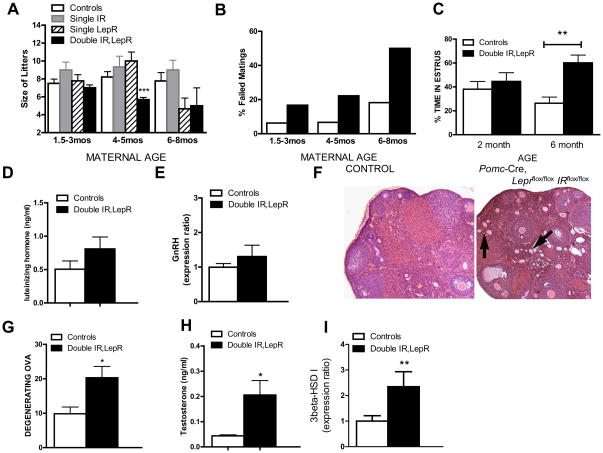
Circulating leptin and insulin convey information regarding energy stores to the central nervous system, particularly the hypothalamus. Hypothalamic pro-opiomelanocortin (POMC) neurons regulate energy balance and glucose homeostasis and express leptin and insulin receptors. However, the physiological significance of concomitant leptin and insulin action on POMC neurons remains to be established. Here, we show that mice lacking both leptin and insulin receptors in POMC neurons (Pomc-Cre, Lepr(flox/flox) IR(flox/flox) mice) display systemic insulin resistance, which is distinct from the single deletion of either receptor. In addition, Pomc-Cre, Lepr(flox/flox) IR(flox/flox) female mice display elevated serum testosterone levels and ovarian abnormalities, resulting in reduced fertility. We conclude that direct action of insulin and leptin on POMC neurons is required to maintain normal glucose homeostasis and reproductive function.


Figures

Figure 1
Figure 1. POMC neurons in Pomc-Cre, Leprflox/flox IRflox/flox mice no longer respond to leptin
Leptin was administered ip (10microg) and animals perfused. B, POMC35S-labeled neurons and C, STAT3 phosphorylation colocalized with POMC35S-labeled neurons were quantified in the rostral and caudal ARC (Paxinos levels 43 and 47) in littermate controls (white bars) and Pomc-Cre, Leprflox/flox IRflox/flox mice (black bars). Values are presented as means +/− SE. See also figure S1.
Figure 2
Figure 2. POMC neurons in Pomc-Cre, Leprflox/flox IRflox/flox mice do not respond to insulin
A, Hypothalamic organotypic slices from FoxO1GFP-POMC reporter mice were treated with insulin (100 nM for 30 min) or vehicle and compared with slices from Pomc-Cre, Leprflox/flox IRflox/flox mice carrying the FoxO1GFP reporter and subjected to anti-GFP immunohistochemistry. Scale bar, 20 μm. B, The percentage of neurons with cytoplasmic FoxO1GFP. C. Current-clamp recordings at resting membrane potential depicting an insulin-induced hyperpolarization and a leptin-induced depolarization in separate POMC neurons from POMC-GFP mice. Downward deflections are responses to rectangular current steps. D. Current-clamp recordings show insulin and leptin fail to influence the membrane potential of POMC neurons in Pomc-Cre, Leprflox/flox IRflox/flox mice. E. Histogram of insulin- and leptin-induced responses in identified POMC neurons from POMC-GFP and Pomc-Cre, Leprflox/flox IRflox/flox mice. Values are means +/− SE. ***p < 0.001, compared by 2-way ANOVA followed by Bonferroni post-hoc. See also figure S2.
Figure 3
Figure 3. Altered metabolism and POMC expression in Pomc-Cre, Leprflox/flox IRflox/flox mice
A, Body weight curves of male Leprflox/flox IRflox/flox mice (open squares, n = 12), Pomc-Cre, IRflox/flox (filled grey triangles, n = 16), Pomc-Cre, Leprflox/flox (open black triangles and dashed line, n = 8), and Pomc-Cre, Leprflox/flox IRflox/flox mice (filled black circles, n = 9), and body weight curves of female Leprflox/flox IRflox/flox mice (open squares, n = 10), Pomc-Cre, IRflox/flox (filled grey triangles, n = 18), Pomc-Cre, Leprflox/flox (open black triangles and dashed line, n = 8), and Pomc-Cre, Leprflox/flox IRflox/flox mice (filled black circles, n = 8) on standard chow. B, Cumulative food intake in male and female Leprflox/flox IRflox/flox mice (filled dark grey squares, n = 13,13) and Pomc-Cre, Leprflox/flox IRflox/flox mice (open light grey circles, n = 9,10) over time. C, Fat mass in a separate cohort of 6 month old Lepr flox/flox, IR flox/flox (white bars), Pomc-Cre, IR flox/flox (grey bars), Pomc-Cre, Lepr flox/flox (striped bars), and Pomc-Cre, Leprflox/flox IRflox/flox mice (black bars) as measured by NMR (n=7–15 per group). Values are means +/− SE. ANOVA: p<0.0001 males, p=0.0124 females. For entire figure, * = p< 0.05, ** = p<0.01, *** = p<0.0001, determined by Bonferroni’s Multiple Comparison Test following one-way ANOVA for each group or time point. D, Relative expression of POMC as measured by qPCR in Leprflox/flox IRflox/flox (white bars, n=14–18), Leprflox/flox,POMC-Cre (striped bars, n=7–9), and Leprflox/flox IRflox/flox POMC-Cre (black bars, n=7–8) mouse hypothalami. E, O2 consumption, F, ambulatory activity, and G respiratory exchange rate in 3 month old female mice lacking insulin and LepRs in POMC neurons (black bars, n=9), lacking only LepRs (striped bars, n=7), and littermate controls (white bars, n=12)
Figure 4
Figure 4. Insulin resistance in mice lacking both IRs and LepRs in POMC neurons
A, Serum insulin levels were measured by ELISA following removal of food for 2 hours in 3 month old male (n=14–19) and female (n=7–21) Pomc-Cre, Leprflox/flox IRflox/flox and Cre negative littermate controls and analyzed by one-way ANOVA followed by Tukey’s post-hoc test. B, D, Adult male and female Pomc-Cre, Leprflox/flox IRflox/flox and littermates lacking POMC-cre (n = 7–8) were matched by weight and subjected to a GTT (1mg/kg). E, Male Pomc-Cre, Leprflox/flox IRflox/flox and Leprflox/flox IRflox/flox mice (n = 7) littermates 3 month of age were subjected to an ITT. Blood glucose levels were measured following injection of insulin (0.75U/kg). Values are presented as means +/− SE. Statistical significance as shown by p value was determined by comparison of area under the curve, and significant differences at individual time points were evaluated by t-test. F. Isolated islets (6 islets per well) from 3 month old male mice were incubated in 5mM or 17.5mM glucose for 1 hour and the secreted insulin in the media was harvested for insulin assay. Values are presented as means +/− SE. * p<0.05, ** p<0.01 See also figure S3.
Figure 5
Figure 5. Failure to suppress endogenous glucose production during hyperinsulinemic-euglycemic clamps
A, Basal and clamp insulin B, blood glucose C, Glucose infusion rate (GIR) D, HGP (EndoRa) and E, Glucose disposal rate (Rd) in conscious 2 month old female Leprflox/flox IRflox/flox (white bars, n=5), and Pomc-Cre, Leprflox/flox IRflox/flox (black bars, n=5) mice. Values are presented as means +/− SE. * p<0.05 See also figure S4.
Figure 6
Figure 6. Reduced fertility in Pomc-Cre, Leprflox/flox IRflox/flox mice
A, Number of pups born to Lepr flox/flox, IR flox/flox (white bars), Pomc-Cre, IR flox/flox (grey bars), Pomc-Cre, Lepr flox/flox (striped bars), and Pomc-Cre, Leprflox/flox IRflox/flox dams (black bars) that were 1.5–3 months of age (n=7–30), 4–5 months of age (n=7–14), or 6–8 months of age (n = 7–9). B, Percentage of Lepr flox/flox, IR flox/flox (white bars) and Pomc-Cre, Leprflox/flox IRflox/flox dams (black bars) caged with control males that failed to produce a litter in two months. C, Pomc-Cre, Leprflox/flox IRflox/flox mice (black bars, n=7) and littermate controls (Lepr flox/flox, IR flox/flox; white bars, n=7) were examined daily for 3 weeks for estrus length via vaginal cytology. Smears showing predominantly cornified cells were considered estrus-like. Data was analyzed by t-test. D, Blood was collected from female mice on diestrus as determined by vaginal cytology for assay of luteinizing hormone levels by RIA. Groups were compared by t-test. (n=16, 20) E, relative expression of GnRH as measured by qPCR in Leprflox/flox IRflox/flox (white bars, n=7), Leprflox/flox,POMC-Cre (striped bars, n=7), and Leprflox/flox IRflox/flox POMC-Cre (black bars, n=7) female mouse hypothalami. Values are means +/− SE. E,F, Sliced and H&E stained paraffin-embedded ovarian tissue from Pomc-Cre, Leprflox/flox IRflox/flox mice (black bars, n=10) and littermate controls (Lepr flox/flox, IR flox/flox; white bars, n=10, 6) was examined for number of degenerating ova. G, Blood was collected from female mice on diestrus for assay of testosterone levels by RIA. (n=7) H, relative expression of murine 3β-HSD type I as measured by qPCR in Leprflox/flox IRflox/flox (white bars, n=10), and Leprflox/flox IRflox/flox POMC-Cre (black bars, n=11) female mouse ovaries by qPCR. Values are presented as means +/− SE. Groups were compared by t-test.

Similar articles

Cited by

References

    1. Accili D, Arden KC. FoxOs at the crossroads of cellular metabolism, differentiation, and transformation. Cell. 2004;117:421–426. - PubMed
    1. Adashi EY, Hsueh AJ, Yen SS. Insulin enhancement of luteinizing hormone and follicle-stimulating hormone release by cultured pituitary cells. Endocrinology. 1981;108:1441–1449. - PubMed
    1. Balthasar N, Coppari R, McMinn J, Liu SM, Lee CE, Tang V, Kenny CD, McGovern RA, Chua SC, Jr, Elmquist JK, et al. Leptin receptor signaling in POMC neurons is required for normal body weight homeostasis. Neuron. 2004;42:983–991. - PubMed
    1. Barbieri RL, Makris A, Randall RW, Daniels G, Kistner RW, Ryan KJ. Insulin stimulates androgen accumulation in incubations of ovarian stroma obtained from women with hyperandrogenism. J Clin Endocrinol Metab. 1986;62:904–910. - PubMed
    1. Baskin D, Schwartz MW, Seeley RJ, Woods SC, Porte D, Jr, Breininger JF, Jonak Z, Schaefer J, Krouse M, Burghardt C, et al. Leptin receptor long-form splice-variant protein expression in neuron cell bodies of the brain and co-localization with neuropeptide Y mRNA in the arcuate nucleus. J Histochem Cytochem. 1999;47:353–362. - PubMed

Publication types