. 2010 Mar 17;2(23):23ra20.
doi: 10.1126/scitranslmed.3000488.

Mutations in fibrillin-1 cause congenital scleroderma: stiff skin syndrome

Affiliations

Mutations in fibrillin-1 cause congenital scleroderma: stiff skin syndrome

B L Loeys et al. Sci Transl Med. .

Abstract

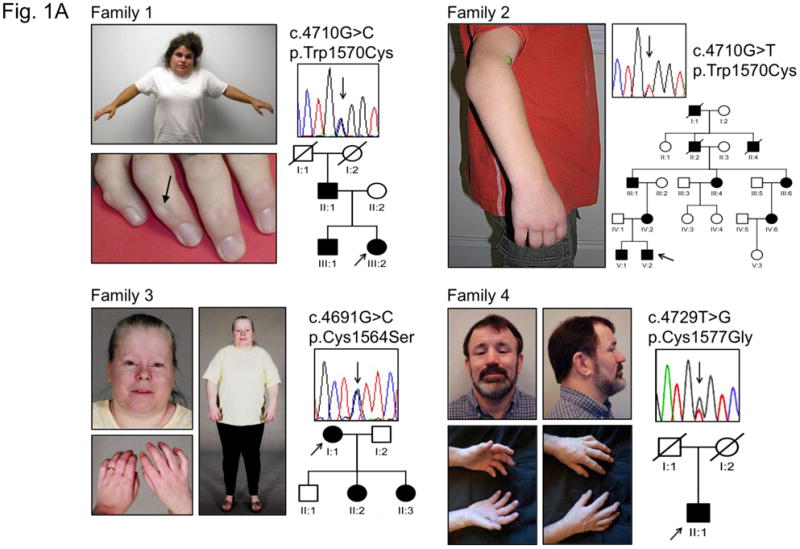
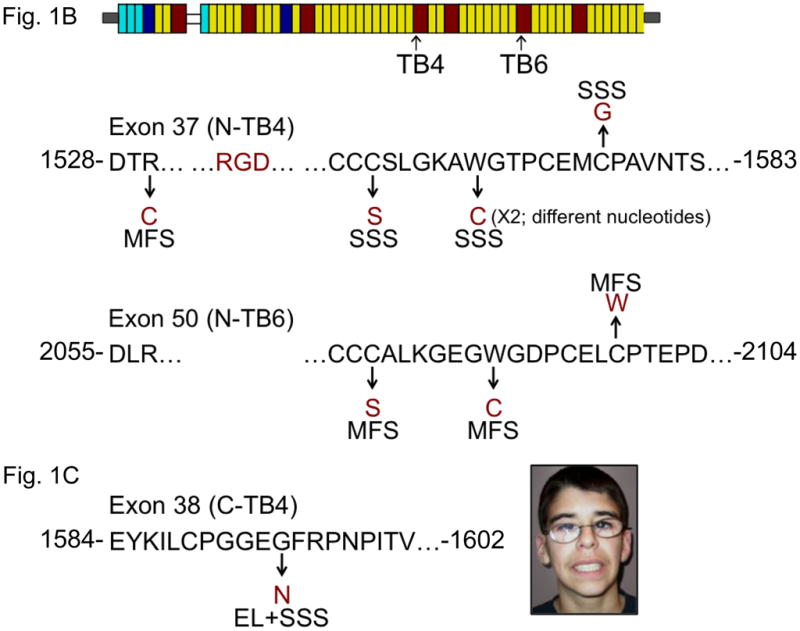
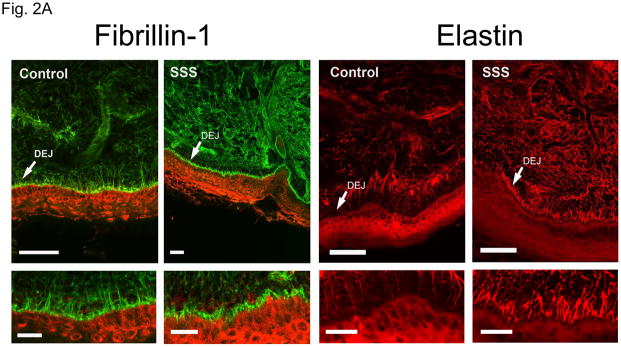
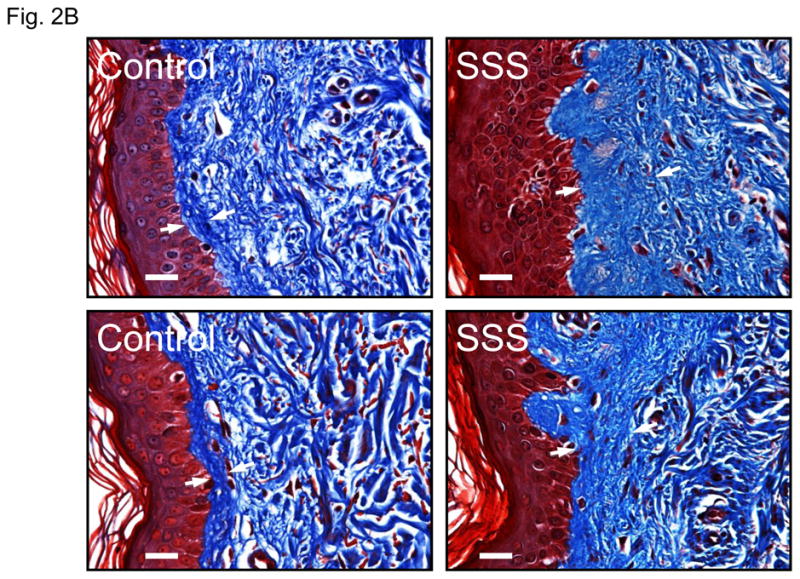
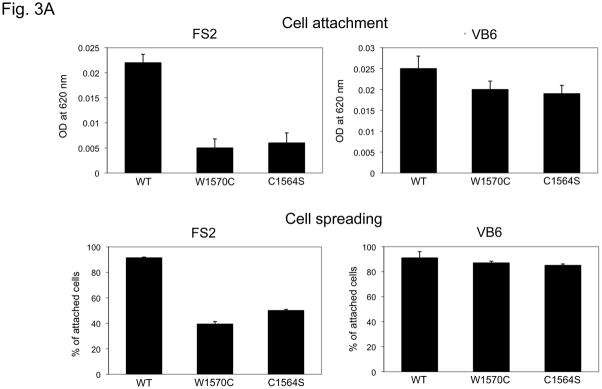
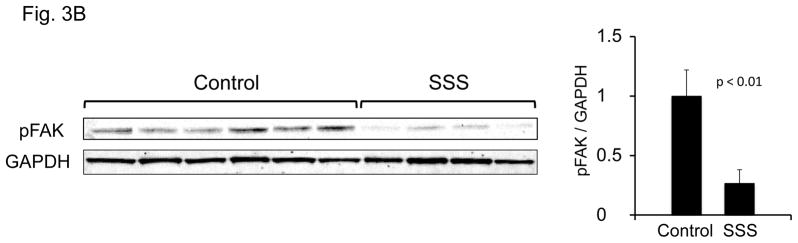
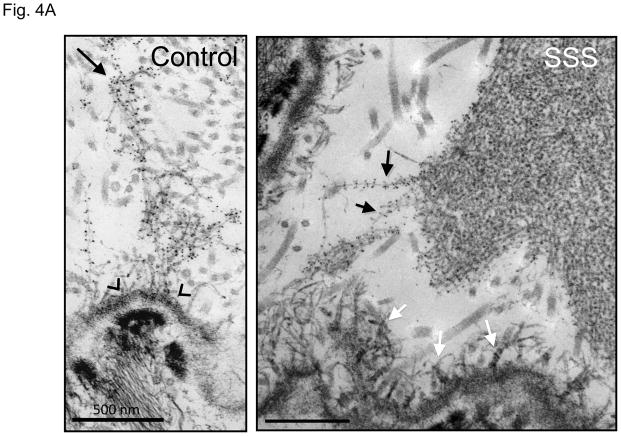
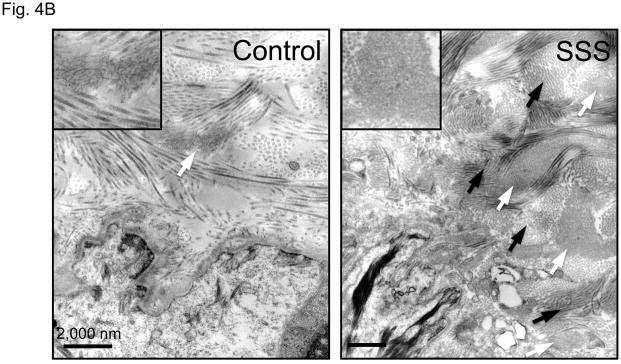
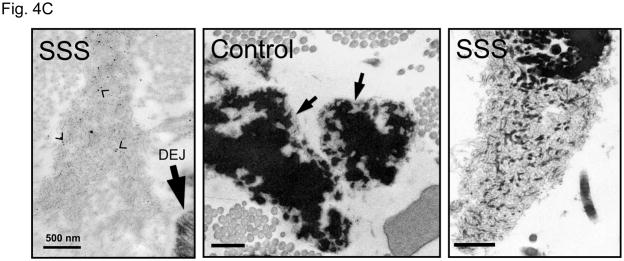
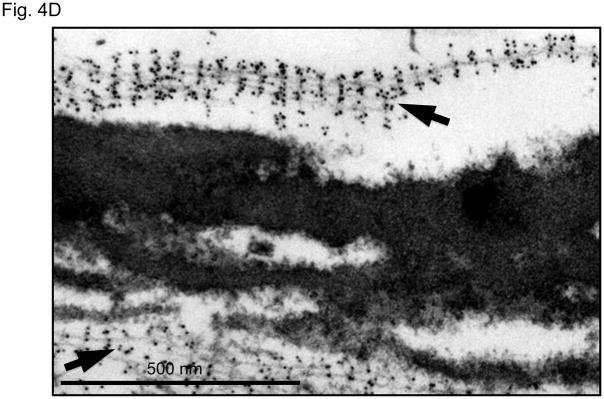
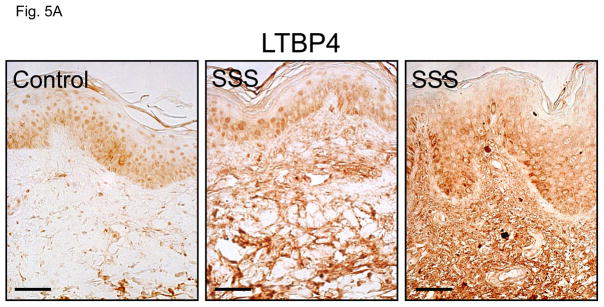
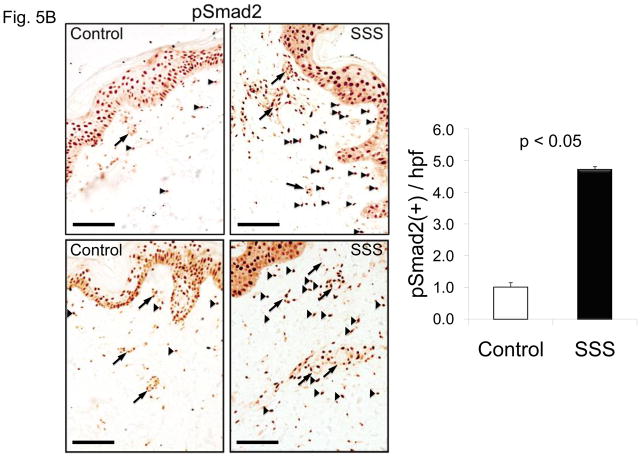
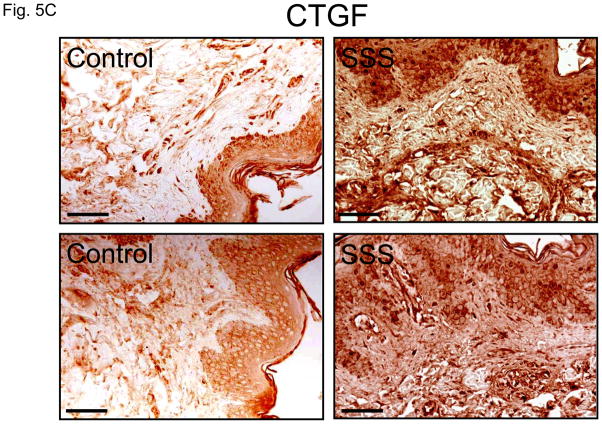
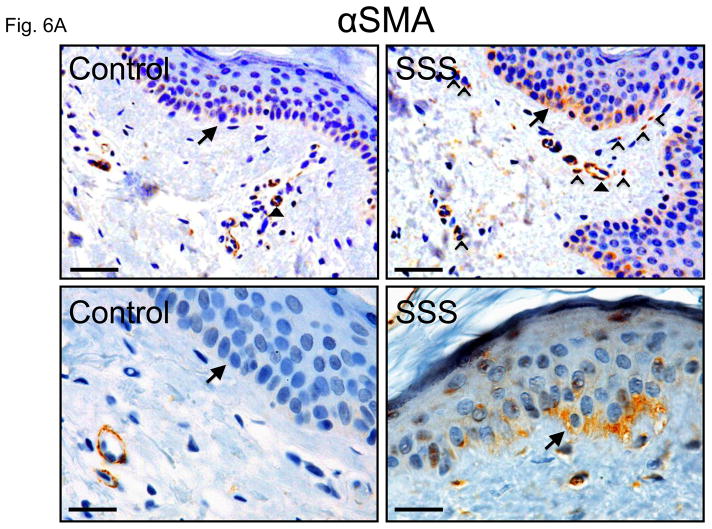
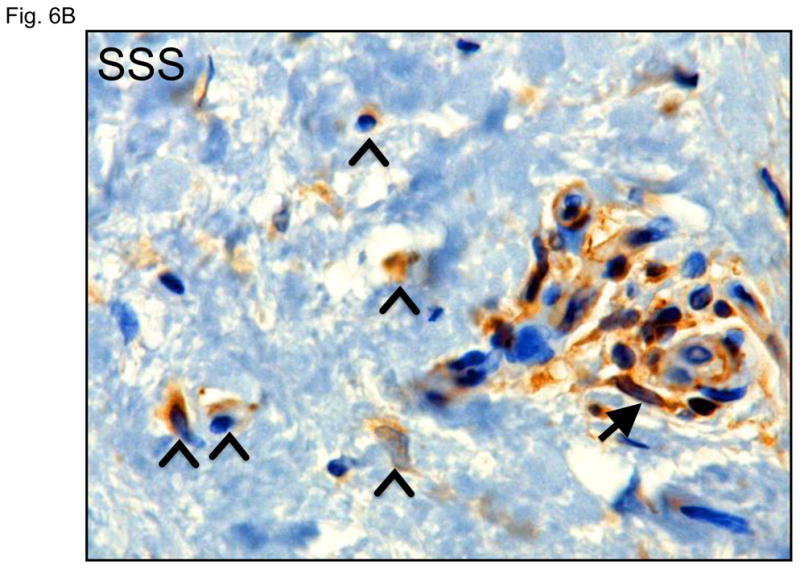
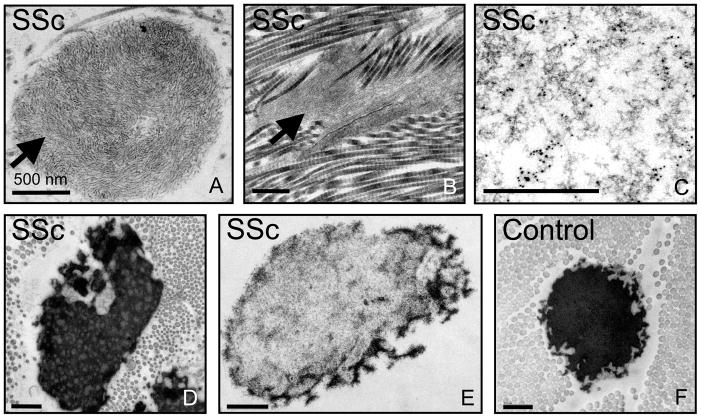
The predisposition for scleroderma, defined as fibrosis and hardening of the skin, is poorly understood. We report that stiff skin syndrome (SSS), an autosomal dominant congenital form of scleroderma, is caused by mutations in the sole Arg-Gly-Asp sequence-encoding domain of fibrillin-1 that mediates integrin binding. Ordered polymers of fibrillin-1 (termed microfibrils) initiate elastic fiber assembly and bind to and regulate the activation of the profibrotic cytokine transforming growth factor-beta (TGFbeta). Altered cell-matrix interactions in SSS accompany excessive microfibrillar deposition, impaired elastogenesis, and increased TGFbeta concentration and signaling in the dermis. The observation of similar findings in systemic sclerosis, a more common acquired form of scleroderma, suggests broad pathogenic relevance.


Figures

Figure 1
Figure 1. Characterization of SSS and hybrid patients
(A) Phenotypic characteristics, FBN1 mutation and pedigree for families 1–4. Pedigrees of families 1–3 document an autosomal dominant pattern of inheritance. Individual 1-III:2 shows decreased facial expression due to tightness of the skin and limited shoulder elevation. Note nodules at the distal interphalangeal joints (arrow). Individual 2-V:2 demonstrates limited extension of the elbows. Individual 3-I:1 shows a tight facial expression and limited extension of fingers and elbows. Individual 4-II:1 shows tightness of facial skin and limited flexion/extension of the fingers along with the presence of multiple interphalangeal nodules. The position of the nucleotide substitutions is indicated by arrows. Impact of mutations at the protein level are indicated using the three letter amino acid code. Circle, female; square, male; open symbol, unaffected; shaded symbol, affected; diagonal line, deceased; arrows below symbols indicate probands. (B) Diagram representing the domain structure of the fibrillin-1 protein. Yellow rectangles, calcium binding epidermal growth factor domain; red rectangles, transforming growth factor beta binding protein-like domain (TB domain); light blue rectangles, non-calcium binding epidermal growth factor-like module, dark blue rectangles, hybrid domains. Arrows indicate the fourth and sixth TB domains (TB4 and TB6, respectively), encoded by exons 37-38 and exons 50–51 of the FBN1 gene. The location of the RGD motif (arginine-glycine-aspartic acid) is indicated within a partial peptide sequence (positions of the first and last amino acid residues indicated) encoded by exon 37. In exon 37, encoding the N-terminal portion of TB4 (N-TB4), the substituted amino acid residues in the four SSS families are indicated. Mutations affecting the corresponding amino acid residues in exon 50 (encoding TB6) result in typical MFS syndrome (55). A mutation N-terminal to the RGD sequence in TB4 (p.Arg1530Cys) also causes MFS. (C) Position of FBN1 mutation (p.Gly1594Asn) in exon 38 in the patient with the hybrid (stiff skin and ectopia lentis) phenotype (inset). Exon 38 encodes the C-terminal portion of the fourth TB domain (C-TB4). The single letter amino acid code is utilized (R-arginine, C-cysteine, G-glycine, D-aspartic acid, S-serine, W-tryptophan, N-asparagine).
Figure 2
Figure 2. Elastin, fibrillin-1 and collagen composition of skin biopsies
(A) Confocal microscopy of skin biopsies (with keratin in the epithelium delineated in red) from a patient with SSS and a control, seen at low magnification (upper panel) and high magnification (lower panel). The control sample shows long microfibrillar projections from the dermal-epidermal junction (DEJ, arrow) into the superficial (papillary) dermis with relatively sparse fibrillin-1 deposition in the deeper dermis. There is relative exclusion of elastin in the superficial dermis immediately adjacent to the DEJ. The SSS sample shows stubby microfibrillar deposits immediately adjacent to the DEJ that co-localize with elastin. There is also increased deposition of elastin in the deeper dermis. Scale bars = upper row of low magnification images, 50 microns; lower row of high magnification images, 20 microns. (B) Trichrome staining of skin biopsies from two controls and two SSS patients. Note the widened zone of increased deposition of collagen (blue) in the papillary dermis of SSS patients, as delineated by white arrows. Scale bars, 20 microns
Figure 3
Figure 3. Cell spreading and attachment
(A) Cell attachment (upper panel) and spreading (lower panel) of FS2 dermal fibroblasts (left panel) and VB6 keratinocytes (right panel) adherent on recombinant wild-type and mutant cbEGF22-TB4-cbEGF23 W1570C and C1564S protein constructs. Wild-type cbEGF22-TB4-cbEGF23 was used as a positive control and BSA as negative control. In contrast to FS2 cells, similar attachment and spreading profiles were observed for VB6 cells plated onto wild-type and mutant fragments. Data are expressed as mean ±S.D. (attachment, n=9; spreading, n=5), from three independent experiments. (B) Assessment of phosphorylated focal adhesion kinase protein (phosphorylation at Y397) at steady state comparing six controls and four SSS patients. Quantification shows decreased pFAK in SSS.
Figure 4
Figure 4. Electron microscopy (EM) and immuno-EM of skin biopsies
(A) Immuno-gold labeling of fibrillin-1 at the dermal-epidermal junction (DEJ) in control skin reveals periodic labeling of lacey microfibrillar bundles which make contact with the basement membrane at zones adjacent to hemidesmosomes (open arrowheads) and extend deeply into the papillary dermis (black arrow). In the SSS, microfibrils with periodic labeling (black arrows) are seen at the periphery of giant microfibrillar aggregates but do not make contact with the basement membrane, instead we did see an increased number and wider distribution of anchoring fibrils (white arrows), that are largely composed of type VII collagen. Scale bars, 500 nm. (B) The skin in SSS is densely packed with microfibrillar chords (white arrows). Dense microfibrillar accumulation is also shown at higher magnification in the inset. Chords are embedded in dense collagen bundles (black arrows) in SSS patients compared to the control. Scale bars, 2 μm. (C) Immuno-gold labeling reveals the atypical presence of elastin (arrowheads) within fibrillin-1 deposits immediately adjacent to the DEJ (black arrow) within SSS skin (left panel). Homogeneously-dense deposits of elastin (black material) are surrounded by a thin mantle of microfibrils (arrows) in the papillary and reticular dermis of control skin (middle panel). Within SSS skin, patchy accumulations of elastin are often sparsely distributed within dense microfibrillar aggregates (right panel). Scale bars, 500 nm. (D) Immuno-EM reveals that SSS patients retain the capacity to form some normal elastic fibers, particularly in the reticular dermis, as demonstrated by homogeneous elastin cores with a sheath of microfibrils (arrows) that label with normal periodicity using an antibody specific for fibrillin-1 (mAb 69). Scale bar, 500 nm.
Figure 5
Figure 5. Immunohistochemical assessment of TGFβ concentration and signaling
(A, C) Increased immunostaining for latent transforming growth factor binding protein 4 (LTBP4) and connective tissue growth factor (CTGF) throughout the dermis of two SSS patients compared to control. Scale bars in panel A, C 30 micron and 80 micron, respectively (B) Immunostaining for phosphorylated Smad2 (pSmad2) in the dermis of two control individuals and two SSS patients. Note the increased number nuclei intensely stained for pSmad2 (black arrowheads) in samples from the SSS patients compared to controls, indicative of increased TGFβ signaling. Quantification was performed by counting the number of nuclei (not associated with blood vessels, arrows) with intense pSmad2 signal in at least ten high power fields in two SSS patients by three independent observers blinded to phenotype. Data with SEM expressed after normalization to a randomly selected control sample. Scale bar, 100 micron
Figure 6
Figure 6. Immunohistochemistry for α smooth muscle actin
(A) Increased alpha-smooth muscle actin (αSMA) in basal keratinocytes within the epidermis (arrows) and in cells in the superficial dermis (open arrowheads) of two SSS patients compared to two controls. Note that the intensity of the signal around small blood vessels (closed arrowheads) is comparable in both patients and controls, confirming specificity of the abnormally intense staining of basal keratinocytes and isolated dermal cells in SSS. Scale bars top panel, 50 micron, bottom panel, 20 micron (B) In addition, SSS samples also occasionally show αSMA-positve cells occluding small vessels (arrow) and migrating around their periphery (open arrowheads).
Figure 7
Figure 7. Electron microscopy of skin biopsies from patients with systemic sclerosis
(A,B) Electron microscopy reveals abnormally organized and dense macroaggregates of microfibrils (arrows) in the papillary and reticular dermis of patients with systemic sclerosis (SSc) that are reminiscent of those seen in SSS. (B) These abnormal aggregates of microfibrils in SSc are often embedded within dense deposits of collagen. (C) Immuno-EM demonstrates labeling of microfibrillar aggregates with an antibody directed against LTBP4 in SSc. (D, E) Abnormal appearance of elastic fibers in SSc, including a mottled appearance (D) or an overt paucity of elastin (E) compared to the homogeneously-dense elastin core in an age- and gender-matched control. Images are representative of those seen in five SSc patients. Scale bar, 500 nm except in (C), 200 nm.

Comment in

References

    1. Wigley FM. Vascular disease in scleroderma. Clin Rev Allergy Immunol. 2009;36:150–175. - PubMed
    1. Esterly NB, McKusick VA. Stiff skin syndrome. Pediatrics. 1971;47:360–369. - PubMed
    1. Amoric JC, Stalder JF, David A, Bureau B, Pierard GE, Litoux P. Dysmorphism in Stiff Skin syndrome. Ann Dermatol Venereol. 1991;118:802–804. - PubMed
    1. Bodemer C, Habib K, Teillac D, Munich A, de Prost Y. A new case of Stiff Skin syndrome. Ann Dermatol Venereol. 1991;118:805–806. - PubMed
    1. Bundy SE, Lie K. Stiff skin syndrome. Birth Defects Orig Artic Ser. 1975;11:360–361. - PubMed

Publication types

MeSH terms