. 2010 Jul 2;285(27):21092-102.
doi: 10.1074/jbc.M110.104836. Epub 2010 Apr 7.

Claudin association with CD81 defines hepatitis C virus entry

Affiliations

Claudin association with CD81 defines hepatitis C virus entry

Helen J Harris et al. J Biol Chem. .

Abstract

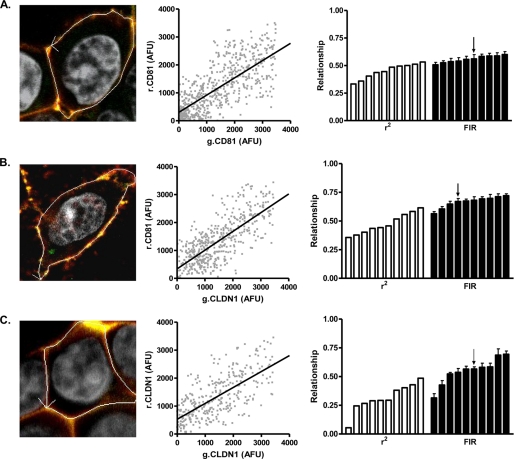
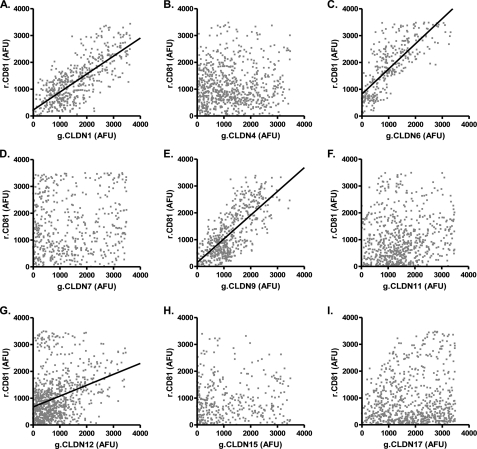
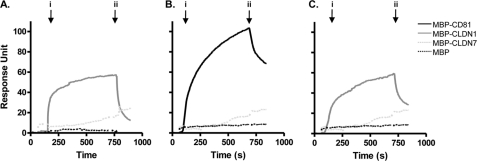
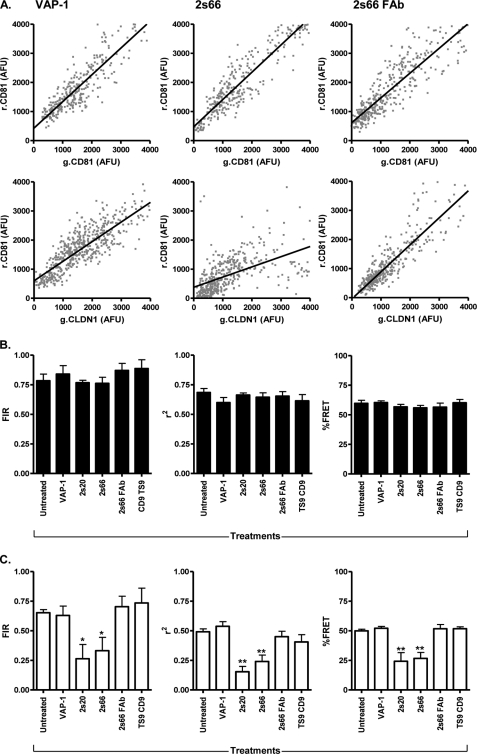
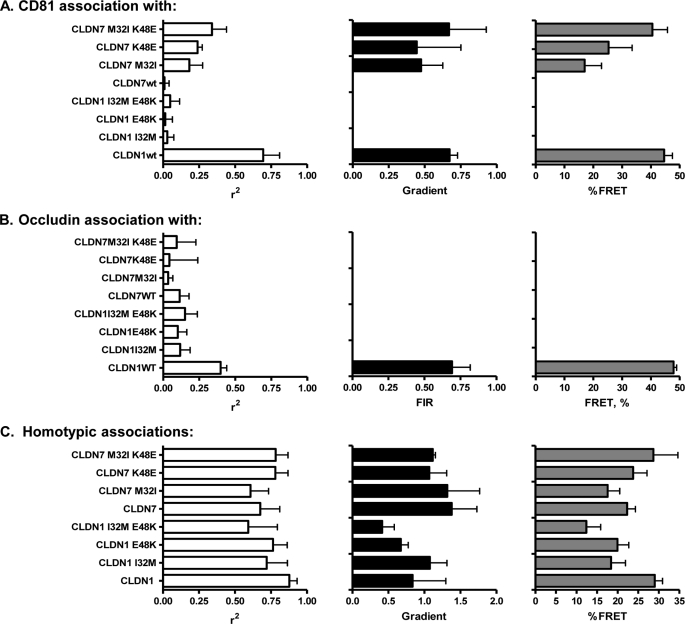
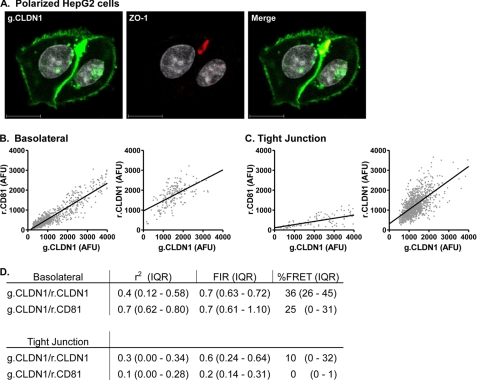
Viruses initiate infection by attaching to molecules or receptors at the cell surface. Hepatitis C virus (HCV) enters cells via a multistep process involving tetraspanin CD81, scavenger receptor class B member I, and the tight junction proteins Claudin-1 and Occludin. CD81 and scavenger receptor class B member I interact with HCV-encoded glycoproteins, suggesting an initial role in mediating virus attachment. In contrast, there are minimal data supporting Claudin-1 association with HCV particles, raising questions as to its role in the virus internalization process. In the present study we demonstrate a relationship between receptor active Claudins and their association and organization with CD81 at the plasma membrane by fluorescence resonance energy transfer and stoichiometric imaging methodologies. Mutation of residues 32 and 48 in the Claudin-1 first extracellular loop ablates CD81 association and HCV receptor activity. Furthermore, mutation of the same residues in the receptor-inactive Claudin-7 molecule enabled CD81 complex formation and virus entry, demonstrating an essential role for Claudin-CD81 complexes in HCV infection. Importantly, Claudin-1 associated with CD81 at the basolateral membrane of polarized HepG2 cells, whereas tight junction-associated pools of Claudin-1 demonstrated a minimal association with CD81. In summary, we demonstrate an essential role for Claudin-CD81 complexes in HCV infection and their localization at the basolateral surface of polarized hepatoma cells, consistent with virus entry into the liver via the sinusoidal blood and association with basal expressed forms of the receptors.


Figures

FIGURE 1.
FIGURE 1.
Fluorescent intensity ratio of CLDN1 and CD81 in 293T cells. 293T cells were transfected to express AcGFP (g) and DsRED (r) fluorescence-tagged g.CD81-r.CD81 (A); g.CLDN1-r.CD81 (B), or g.CLDN1-r.CLDN1 (C). AcGFP and DsRed arbitrary fluorescence units (AFUs) at the cell periphery were determined by laser scanning confocal microscopy and used to generate a scatter plot, allowing one to calculate a correlation coefficient (r2) and fluorescent intensity ratio (FIR) for each cell analyzed. A representative scatter plot is depicted in the middle column, and the r2 correlation coefficient (white bars) and FIR (black bars) values for ten cells are summarized as a bar chart in the final column, where each bar depicts a single cell, and the arrow denotes the respective values for the presented image and scatter plots. In summary, the median FIR values from analyzing ten cells expressing g.CD81-r.CD81, g.CLDN1-r.CD81, and g.CLDN1-r.CLDN1 were 0.56 (IQR 0.53–0.59 and r2 0.47 (IQR 0.38–0.51)), 0.68 (IQR 0.63–0.74 and r2 0.45 (IQR 0.39–0.57)), and 0.56 (IQR 0.47–0.64 and r2 0.29 (IQR 0.25–0.42)), respectively.
FIGURE 2.
FIGURE 2.
Analysis of CLDN-CD81 interactions. 293T cells were transfected to express DsRED-CD81 (r.CD81) and a panel of AcGFP-tagged CLDN (g.CLDN) constructs (CLDN1–17, panels A–I). Ten cells were imaged as described in Fig. 1, and estimates of r.CD81 association with g.CLDNs were evaluated by regression analysis and summarized in Table 1. The images represent scatter plots closest to the median FIR for each g.CLDN-r.CD81 studied.
FIGURE 3.
FIGURE 3.
Analysis of CLDN1-CD81 extracellular loop interactions by surface plasmon resonance. MBP-CLDN1 EC1 (A) and MBP-CD81 EC2 (B and C) were immobilized onto the bio-sensor chip surface. Homotypic protein interactions were demonstrated by flowing MBP-CLDN1 EC1 (solid gray line) and MBP-CD81 EC2 (solid black line) over the respective chip surfaces (A and B) with both MBP-CLDN7 EC1 (dotted light gray line) and MBP (dotted black line) as negative controls at a concentration of 1 mg/ml. Heterotypic interaction between MBP-CLDN1-EC1 and MBP-CD81 EC2 is depicted in C. To control for nonspecific interactions, all MBP fusion proteins were flowed over an activated and blocked “empty” channel, and the response unit(s) were subtracted from the test channels. The arrow indicates the “association time” i when proteins are flowed over the respective chip surfaces and the “dissociation phase” begins at time ii when protein injection is stopped. Data are representative of two independent experiments.
FIGURE 4.
FIGURE 4.
Anti-CD81 modulation of CD81-CD81 and CLDN1-CD81 association(s). 293T cells were transfected to express AcGFP (g) and DsRED (r) fluorescence-tagged g.CD81-r.CD81 or g.CLDN1-r.CD81 and were treated with control anti-VAP1, anti-CD81 mAbs 2s20 and 2s66, 2s66 FAb fragment, and anti-CD9 TS9 at equimolar concentrations (13 μm) for 1 h at 37 °C. Representative g.CD81-r.CD81 and g.CLDN1-r.CD81 scatter plots of transfected cells treated with anti-VAP-1, anti-CD81 2s66 IgG, and FAb are shown (A). The effect of mAb treatments on g.CD81-r.CD81 (B) and g.CLDN1-r.CD81 (C) mean correlation coefficient (r2) and fluorescent intensity ratio (FIR) of ten cells is presented. One way analysis of variance and Dunnett's multiple comparison test were used to determine the degree of significance (*, p < 0.05; **, p < 0.01).
FIGURE 5.
FIGURE 5.
Effect of mutations in CLDN1 and CLDN7 EC1 on CD81 and Occludin association. 293T cells were transfected to express AcGFP (g) and DsRED (r) fluorescence-tagged wild-type and mutant forms of g.CLDN and r.CD81 (A) or r.Occludin (B), and the degree of association between fluorophore-tagged proteins was assessed by FIR and FRET analysis. C, 293T cells were transfected with AcGFP- and DsRED-tagged versions of wild-type and mutant CLDN constructs to assess the effect of EC1 mutations on CLDN-CLDN cis-interactions. Median FIR and FRET values from ten individual cells are presented (*, p < 0.05; **, p < 0.01).
FIGURE 6.
FIGURE 6.
Effect of cell polarization on CLDN1-CD81 and CLDN1-CLDN1 association. HepG2 cells transfected to express AcGFP (g) and DsRED (r) fluorescence-tagged g.CLDN-r.CD81 and g.CLDN1-r.CLDN1 were allowed to polarize over a period of 3 days. Apical bile canalicular structures were identified by staining with anti-ZO-1 and visualized with alexa-633-conjugated secondary anti-rabbit Ig (A). Representative scatter plots of g.CLDN-r.CD81 and g.CLDN1-r.CLDN1 at basolateral (B) and tight junction (C) membrane domains are shown, and the cumulative data from ten cells are summarized below (D).

Similar articles

Cited by

References

    1. Bartosch B., Vitelli A., Granier C., Goujon C., Dubuisson J., Pascale S., Scarselli E., Cortese R., Nicosia A., Cosset F. L. (2003) J. Biol. Chem. 278, 41624–41630 - PubMed
    1. Hsu M., Zhang J., Flint M., Logvinoff C., Cheng-Mayer C., Rice C. M., McKeating J. A. (2003) Proc. Natl. Acad. Sci. U.S.A. 100, 7271–7276 - PMC - PubMed
    1. Drummer H. E., Maerz A., Poumbourios P. (2003) FEBS Lett. 546, 385–390 - PubMed
    1. Wakita T., Pietschmann T., Kato T., Date T., Miyamoto M., Zhao Z., Murthy K., Habermann A., Kräusslich H. G., Mizokami M., Bartenschlager R., Liang T. J. (2005) Nat. Med. 11, 791–796 - PMC - PubMed
    1. Zhong J., Gastaminza P., Cheng G., Kapadia S., Kato T., Burton D. R., Wieland S. F., Uprichard S. L., Wakita T., Chisari F. V. (2005) Proc. Natl. Acad. Sci. U.S.A. 102, 9294–9299 - PMC - PubMed

MeSH terms