. 2010 Oct 6;7(51):1421-8.
doi: 10.1098/rsif.2010.0056. Epub 2010 Apr 7.

Economically optimal timing for crop disease control under uncertainty: an options approach

Affiliations

Economically optimal timing for crop disease control under uncertainty: an options approach

Martial L Ndeffo Mbah et al. J R Soc Interface. .

Abstract

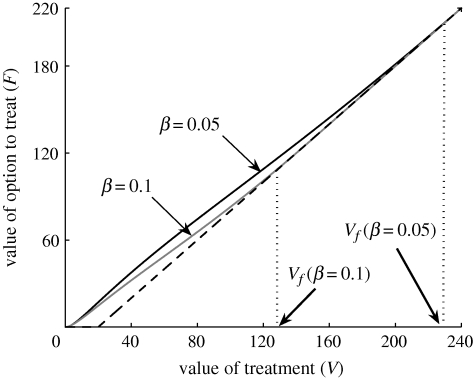
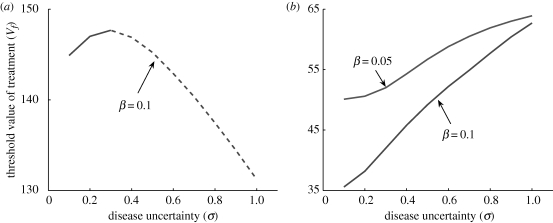
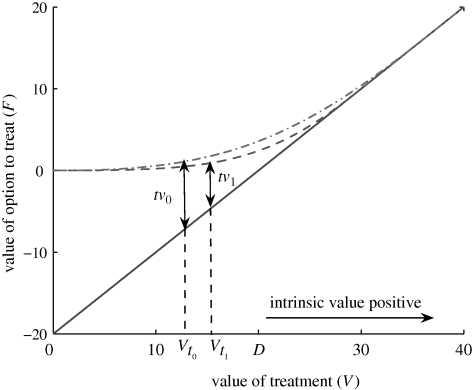
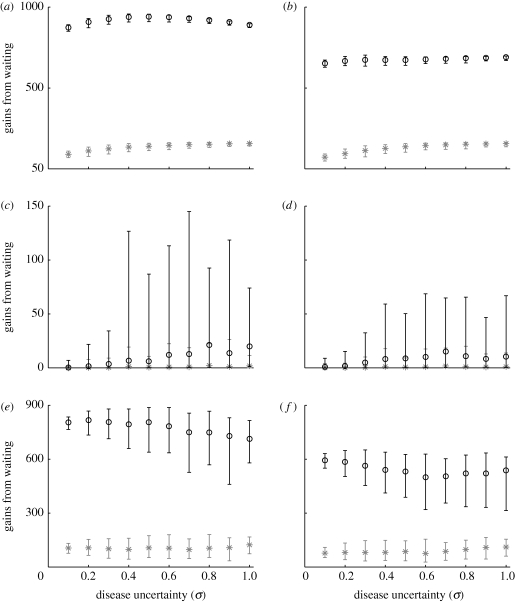
Severe large-scale disease and pest infestations in agricultural regions can cause significant economic damage. Understanding if and when disease control measures should be taken in the presence of risk and uncertainty is a key issue. We develop a framework to examine the economically optimal timing of treatment. The decision to treat should only be undertaken when the benefits exceed the costs by a certain amount and not if they are merely equal to or greater than the costs as standard net-present-value (NPV) analysis suggests. This criterion leads to a reduction in fungicide use. We investigate the effect of the model for disease progress on the value required for immediate treatment by comparing two standard models for disease increase (exponential and logistic growth). Analyses show that the threshold value of benefits required for immediate release of treatment varies significantly with the relative duration of the agricultural season, the intrinsic rate of increase of the disease and the level of uncertainty in disease progression. In comparing the performance of the delay strategy introduced here with the conventional NPV approach, we show how the degree of uncertainty affects the benefits of delaying control.


Figures

Figure 1.
Figure 1.
Relationship between the current value of the option to treat (F) and the value of treatment (V) for varying disease transmission rate (β) for logistic increase in disease. The dashed line represents the intrinsic value of the option (VD) and the dotted lines are the projections from F (at F = VD) on V to identify the threshold value of treatment (Vf). Vf(β = 0.1) and Vf(β = 0.05) are the threshold values of treatment when the disease transmission rate (β) is equal to 0.1 (0.05). Default parameter values are T = 100 d (duration of the epidemic), α = 3 d (duration of protectant activity of treatment), r = 0.1 d−1 (discount rate), I0/Imax = 0.05 (initial proportion of infection relative to the environmental carrying capacity), D = 20 (costs of treatment), and p = 1 (monetary gain in yield per unit of averted infection). The relative magnitudes for costs of treatment and monetary gain from yield (through application of treatment) are expressed in arbitrary units.
Figure 2.
Figure 2.
Relationship between the threshold value of treatment (Vf) and the level of uncertainty in disease severity (σ), derived numerically. (a) Vf at initial time, for disease increase modelled by a logistic function and disease transmission rate (β) equal to 0.1. The solid line represents increasing value and the dashed line represents decreasing value. (b) Vf at a given time t > t* (see the electronic supplementary material), for an exponential model for disease increase and disease transmission rate (β), respectively, equal to 0.05 and 0.1. Default parameter values are given in figure 1.
Figure 3.
Figure 3.
The value of treatment (V) and the value of the option (F) both change simultaneously with time. When the difference between the current value of the option (F) and its intrinsic value (VD), known as the time value (tv), goes to zero the option should be exercised (i.e. the option is equal to its intrinsic value). The figure shows the derivation of the time value at two consecutive times, t0 and t1. It is assumed that at these times, the values of treatment are Vt0 and Vt1. Using these values and values of the option to treat, F(Vt0, t0) and F(Vt1, t1), we calculate the time values tv0 = F(Vt0, t0) − (Vt0D) and tv1 = F(Vt1, t1) − (Vt1D). The solid line denotes the intrinsic value of the option to treat (VD), Ft0 (dot-dashed line) and Ft1 (dashed line) stand, respectively, for the values of the option to treat at t = t0 and t = t1.
Figure 4.
Figure 4.
Gains from waiting under the standard (asterisks) and the real option (open circles) decision approaches for different values of the level of uncertainty in disease severity (σ), under an assumption of logistic (a,c,e) and exponential (b,d,f) increase in disease. Gains are shown, respectively, for the three possible outcomes (scenarios) of the treatment value. First scenario (a,b): V < D for the entire season. Second scenario (c,d): V > D at some point during the season but V < Vf throughout the entire season. Third scenario (e,f): V > Vf at some point during the season. The edges of the error bars show, respectively, the fifth and ninety-fifth percentiles, whereas the circle and the star denote, respectively, the mean value of the gains from waiting under the real option approach and the standard approach. In (c,d), the gains under the standard approach represent the economic gains obtained when V > D.

Similar articles

Cited by

References

    1. Burdon J. J., Chilvers G. A. 1982. Host density as a factor in plant disease ecology. Annu. Rev. Phytopathol. 20, 143–166. (10.1146/annurev.py.20.090182.001043) - DOI
    1. Cook R. J., Hims M. J., Vaughan T. B. 1999. Effects of fundicide spray timing on winter wheat disease control. Plant Pathol. 48, 33–50. (10.1046/j.1365-3059.1999.00319.x) - DOI
    1. Dixit A. K., Pindyck R. S. 1994. Investment under uncertainty. Princeton, NJ: Princeton University Press.
    1. Forsyth M. 2000. On estimating the option value of preserving a wilderness area. Can. J. Econ. 33, 413–434. (10.1111/0008-4085.00022) - DOI
    1. Gilligan C. A. 2002. An epidemiological framework for disease management. Adv. Bot. Res. 38, 1–64.

Publication types

Substances

LinkOut - more resources