

Lower-level stimulus features strongly influence responses in the fusiform face area
- PMID: 20375074
- PMCID: PMC3000561
- DOI: 10.1093/cercor/bhq050
Lower-level stimulus features strongly influence responses in the fusiform face area
Abstract
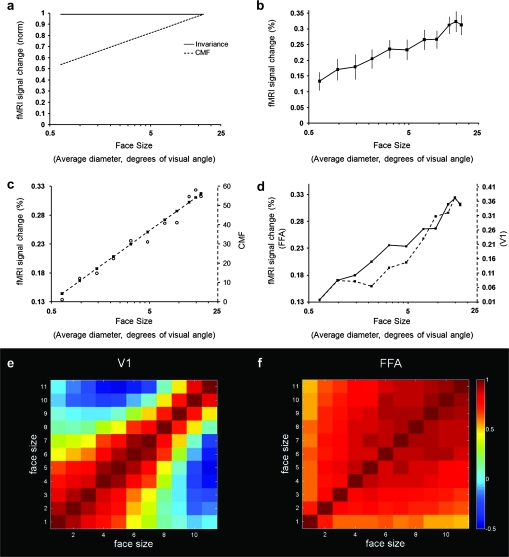
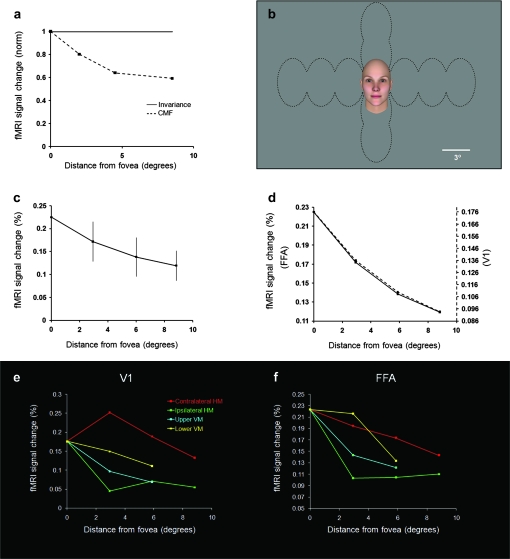
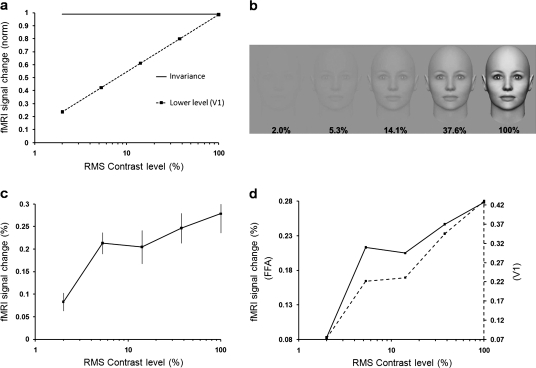
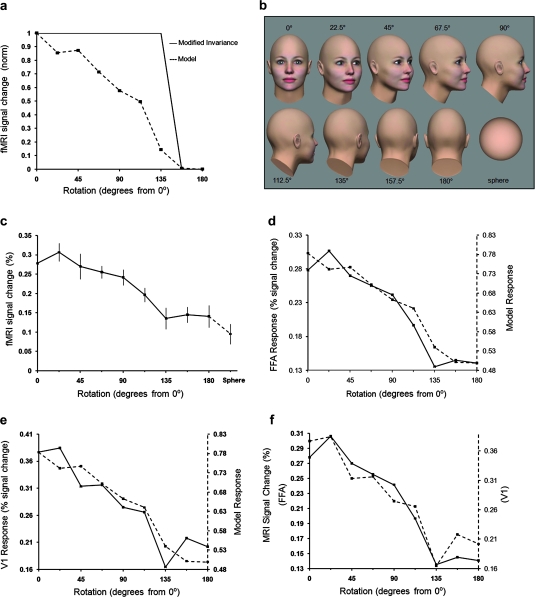
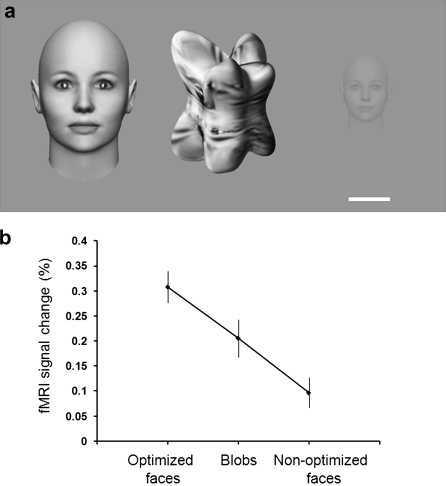
An intriguing region of human visual cortex (the fusiform face area; FFA) responds selectively to faces as a general higher-order stimulus category. However, the potential role of lower-order stimulus properties in FFA remains incompletely understood. To clarify those lower-level influences, we measured FFA responses to independent variation in 4 lower-level stimulus dimensions using standardized face stimuli and functional Magnetic Resonance Imaging (fMRI). These dimensions were size, position, contrast, and rotation in depth (viewpoint). We found that FFA responses were strongly influenced by variations in each of these image dimensions; that is, FFA responses were not "invariant" to any of them. Moreover, all FFA response functions were highly correlated with V1 responses (r = 0.95-0.99). As in V1, FFA responses could be accurately modeled as a combination of responses to 1) local contrast plus 2) the cortical magnification factor. In some measurements (e.g., face size or a combinations of multiple cues), the lower-level variations dominated the range of FFA responses. Manipulation of lower-level stimulus parameters could even change the category preference of FFA from "face selective" to "object selective." Altogether, these results emphasize that a significant portion of the FFA response reflects lower-level visual responses.
Figures
Similar articles
-
Linearity of the fMRI response in category-selective regions of human visual cortex.Hum Brain Mapp. 2009 Aug;30(8):2628-40. doi: 10.1002/hbm.20694. Hum Brain Mapp. 2009. PMID: 19107750 Free PMC article.
-
Category expectation modulates baseline and stimulus-evoked activity in human inferotemporal cortex.Brain Res. 2009 Dec 8;1301:89-99. doi: 10.1016/j.brainres.2009.08.085. Epub 2009 Sep 9. Brain Res. 2009. PMID: 19747463
-
Horizontal tuning for faces originates in high-level Fusiform Face Area.Neuropsychologia. 2016 Jan 29;81:1-11. doi: 10.1016/j.neuropsychologia.2015.12.004. Epub 2015 Dec 9. Neuropsychologia. 2016. PMID: 26683383
-
Evaluating functional localizers: the case of the FFA.Neuroimage. 2010 Mar;50(1):56-71. doi: 10.1016/j.neuroimage.2009.12.024. Epub 2009 Dec 16. Neuroimage. 2010. PMID: 20025980 Free PMC article. Review.
-
Mechanisms of face perception.Annu Rev Neurosci. 2008;31:411-37. doi: 10.1146/annurev.neuro.30.051606.094238. Annu Rev Neurosci. 2008. PMID: 18558862 Free PMC article. Review.
Cited by
-
Being BOLD: The neural dynamics of face perception.Hum Brain Mapp. 2017 Jan;38(1):120-139. doi: 10.1002/hbm.23348. Epub 2016 Sep 1. Hum Brain Mapp. 2017. PMID: 27585292 Free PMC article.
-
Lateralization of face processing in the human brain.Proc Biol Sci. 2012 May 22;279(1735):2052-61. doi: 10.1098/rspb.2011.1784. Epub 2012 Jan 4. Proc Biol Sci. 2012. PMID: 22217726 Free PMC article.
-
Relative tuning of holistic face processing towards the fovea.Vision Res. 2022 Aug;197:108049. doi: 10.1016/j.visres.2022.108049. Epub 2022 Apr 20. Vision Res. 2022. PMID: 35461170 Free PMC article.
-
Unraveling the distributed neural code of facial identity through spatiotemporal pattern analysis.Proc Natl Acad Sci U S A. 2011 Jun 14;108(24):9998-10003. doi: 10.1073/pnas.1102433108. Epub 2011 May 31. Proc Natl Acad Sci U S A. 2011. PMID: 21628569 Free PMC article. Clinical Trial.
-
A previously undescribed scene-selective site is the key to encoding ego-motion in naturalistic environments.Elife. 2024 Mar 20;13:RP91601. doi: 10.7554/eLife.91601. Elife. 2024. PMID: 38506719 Free PMC article.
References
-
- Andrade da Costa BL, Hokoc JN. Photoreceptor topography of the retina in the New World monkey Cebus paella. Vision Res. 2000;40:2395–2409. - PubMed
-
- Andrews TJ, Ewbank MP. Distinct representations for facial identity and changeable aspects of faces in the human temporal lobe. Neuroimage. 2004;23:905–913. - PubMed
-
- Avidan G, Harel M, Hendler T, Ben-Bashat D, Zohary E, Malach R. Contrast sensitivity in human visual areas and its relationship to object recognition. J Neurophysiol. 2002;87:3102–3116. - PubMed
Publication types
MeSH terms
Grants and funding
LinkOut - more resources
Full Text Sources
Research Materials
