

Identification of methylmercury tolerance gene candidates in Drosophila
- PMID: 20375079
- PMCID: PMC2902855
- DOI: 10.1093/toxsci/kfq097
Identification of methylmercury tolerance gene candidates in Drosophila
Abstract
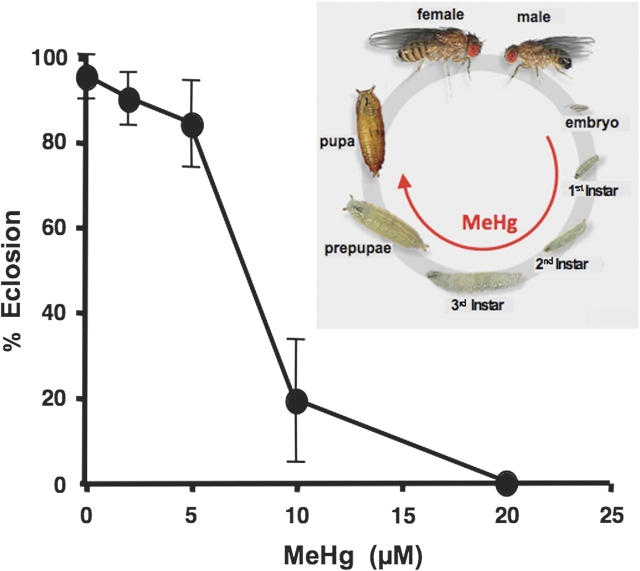
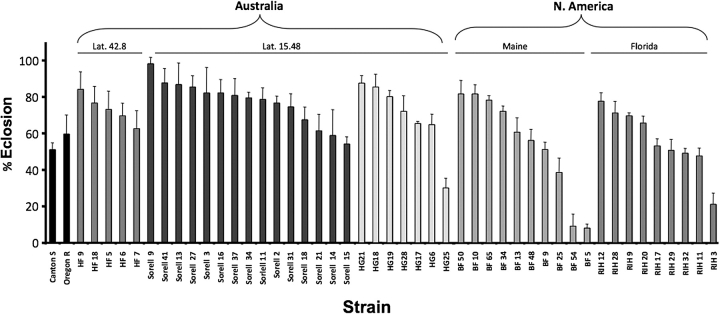
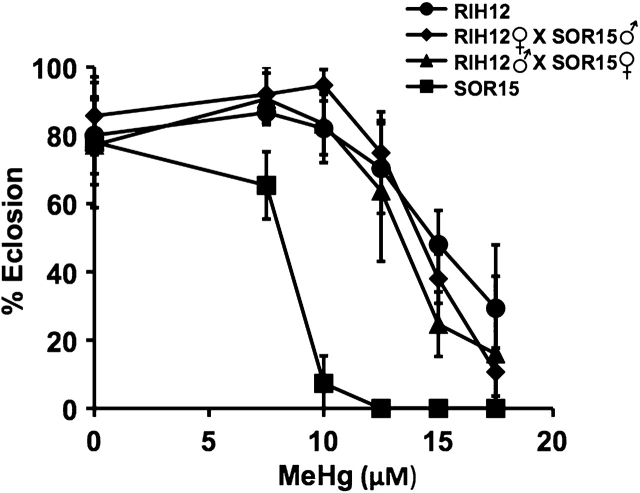
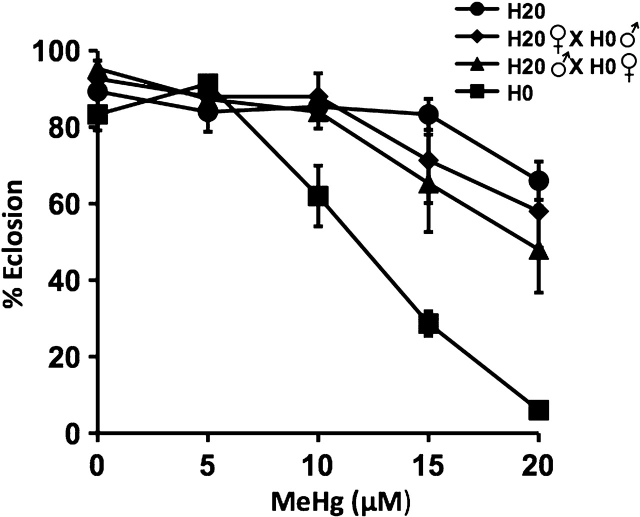
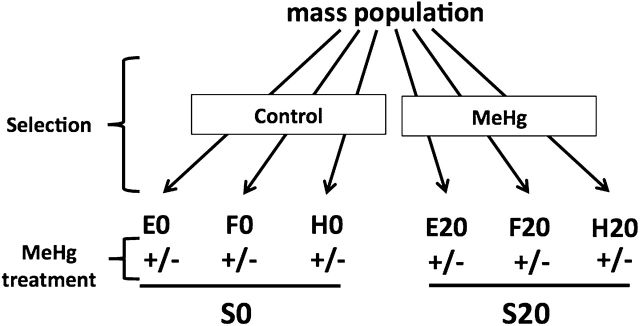
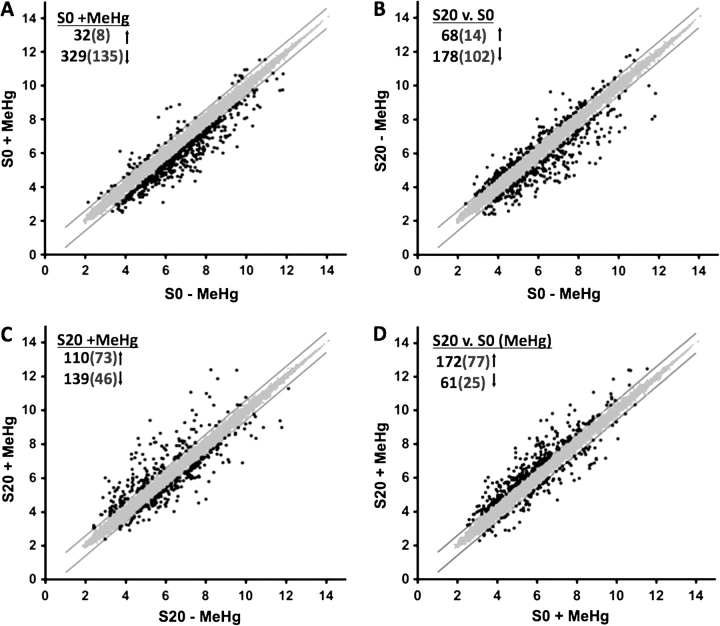
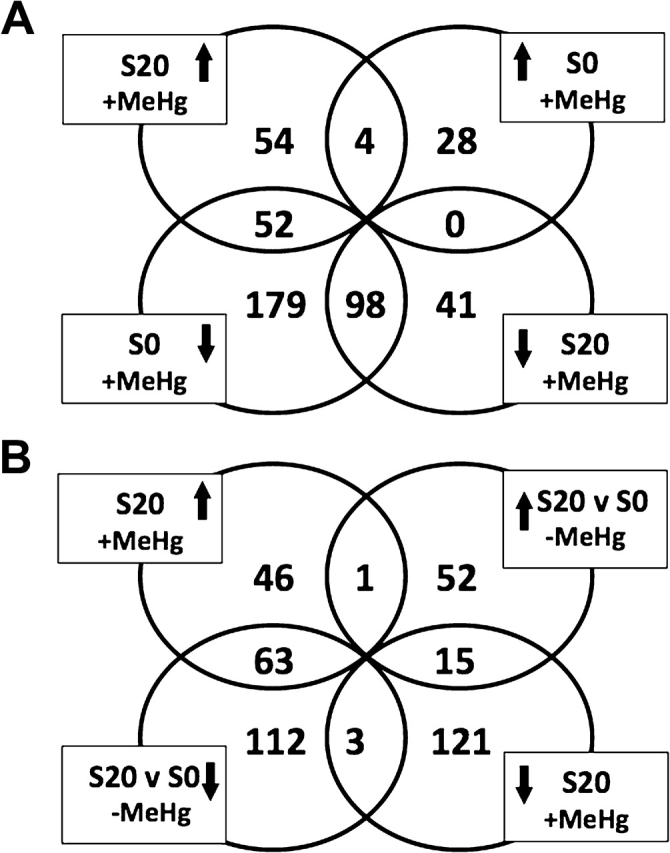
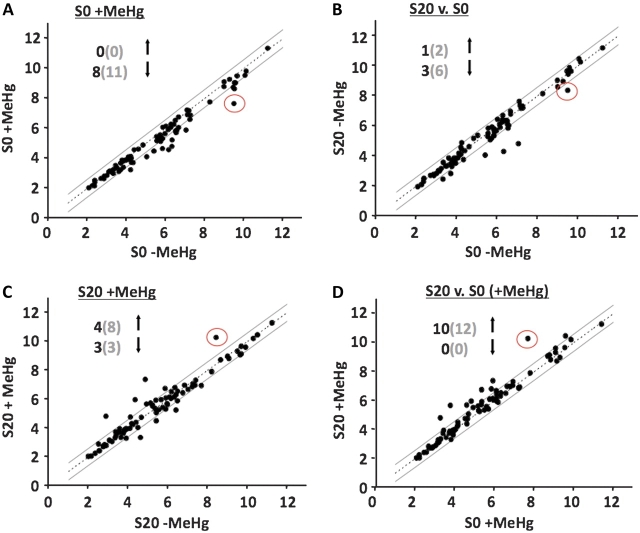
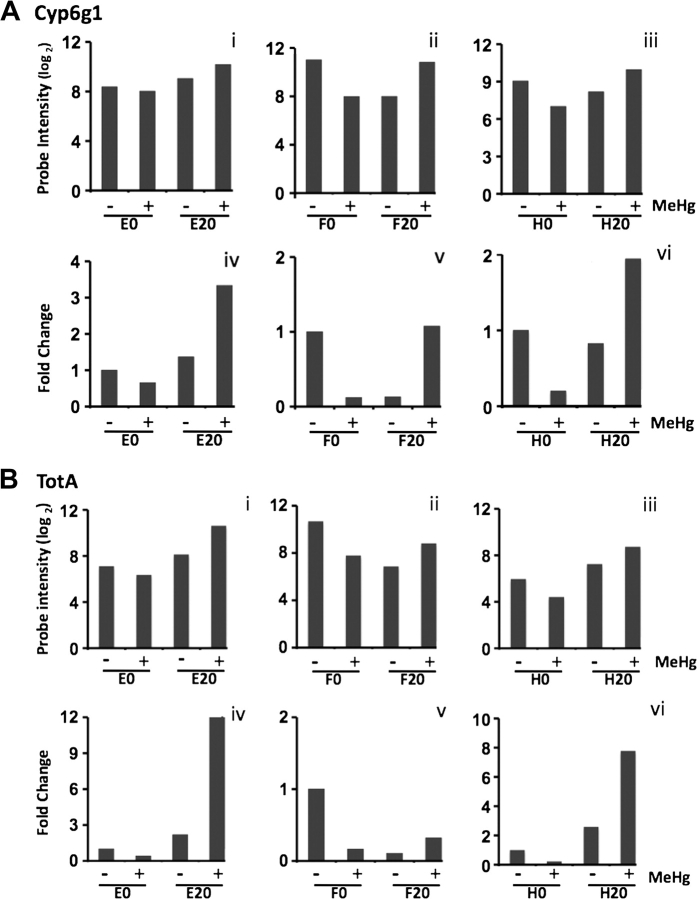
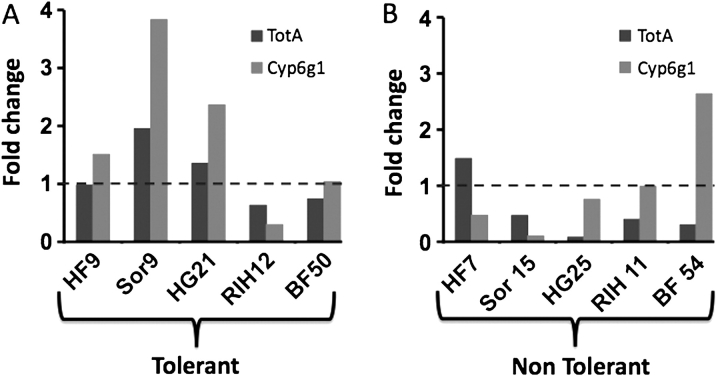
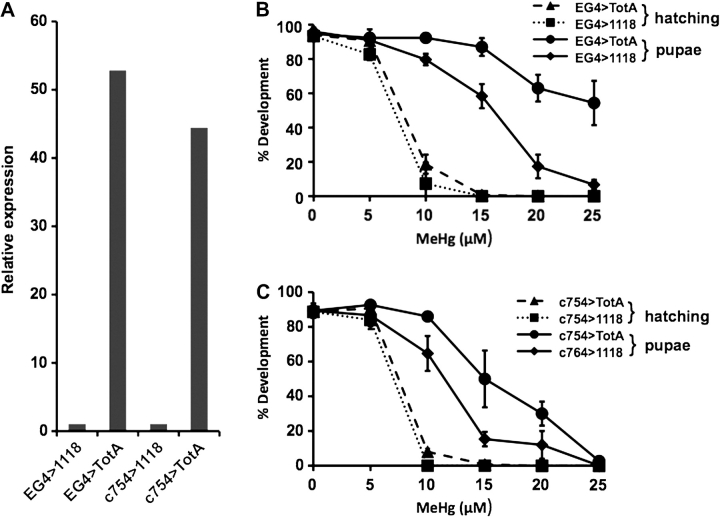
Methylmercury (MeHg) is a ubiquitous environmental contaminant that preferentially targets the developing nervous system. Variable outcomes of prenatal MeHg exposure within a population point to a genetic component that regulates MeHg toxicity. We therefore sought to identify fundamental MeHg tolerance genes using the Drosophila model for genetic and molecular dissection of a MeHg tolerance trait. We observe autosomal dominance in a MeHg tolerance trait (development on MeHg food) in both wild-derived and laboratory-selected MeHg-tolerant strains of flies. We performed whole-genome transcript profiling of larval brains of tolerant (laboratory selected) and nontolerant (control) strains in the presence and absence of MeHg stress. Pairwise transcriptome comparisons of four conditions (+/-selection and +/-MeHg) identified a "down-down-up" expression signature, whereby MeHg alone and selection alone resulted in a greater number of downregulated transcripts, and the combination of selection + MeHg resulted in a greater number of upregulated transcripts. Functional annotation cluster analyses showed enrichment for monooxygenases/oxidoreductases, which include cytochrome P450 (CYP) family members. Among the 10 CYPs upregulated with selection + MeHg in tolerant strains, CYP6g1, previously identified as the dichlorodiphenyl trichloroethane resistance allele in flies, was the most highly expressed and responsive to MeHg. Among all the genes, Turandot A (TotA), an immune pathway-regulated humoral response gene, showed the greatest upregulation with selection + MeHg. Neural-specific transgenic overexpression of TotA enhanced MeHg tolerance during pupal development. Identification of TotA and CYP genes as MeHg tolerance genes is an inroad to investigating the conserved function of immune signaling and phase I metabolism pathways in MeHg toxicity and tolerance in higher organisms.
Figures
Similar articles
-
Methylmercury myotoxicity targets formation of the myotendinous junction.Toxicology. 2020 Oct;443:152561. doi: 10.1016/j.tox.2020.152561. Epub 2020 Aug 13. Toxicology. 2020. PMID: 32800841 Free PMC article.
-
Methylmercury tolerance is associated with the humoral stress factor gene Turandot A.Neurotoxicol Teratol. 2012 Jul;34(4):387-94. doi: 10.1016/j.ntt.2012.04.007. Epub 2012 Apr 24. Neurotoxicol Teratol. 2012. PMID: 22546818 Free PMC article.
-
Drosophila CYP6g1 and its human homolog CYP3A4 confer tolerance to methylmercury during development.Toxicology. 2012 Oct 9;300(1-2):75-82. doi: 10.1016/j.tox.2012.06.001. Epub 2012 Jun 12. Toxicology. 2012. PMID: 22699155 Free PMC article.
-
Methylmercury effects on avian brains.Neurotoxicology. 2023 May;96:140-153. doi: 10.1016/j.neuro.2023.04.004. Epub 2023 Apr 12. Neurotoxicology. 2023. PMID: 37059311 Review.
-
Advances on the Influence of Methylmercury Exposure during Neurodevelopment.Chem Res Toxicol. 2022 Jan 17;35(1):43-58. doi: 10.1021/acs.chemrestox.1c00255. Epub 2022 Jan 6. Chem Res Toxicol. 2022. PMID: 34989572 Review.
Cited by
-
Methylmercury myotoxicity targets formation of the myotendinous junction.Toxicology. 2020 Oct;443:152561. doi: 10.1016/j.tox.2020.152561. Epub 2020 Aug 13. Toxicology. 2020. PMID: 32800841 Free PMC article.
-
Acute exposure to mercury drives changes in gene expression in Drosophila melanogaster.BMC Res Notes. 2024 Sep 30;17(1):279. doi: 10.1186/s13104-024-06945-y. BMC Res Notes. 2024. PMID: 39350189 Free PMC article.
-
Neuroligin-1 Is a Mediator of Methylmercury Neuromuscular Toxicity.Toxicol Sci. 2021 Nov 24;184(2):236-251. doi: 10.1093/toxsci/kfab114. Toxicol Sci. 2021. PMID: 34546366 Free PMC article.
-
Notch Target Gene E(spl)mδ Is a Mediator of Methylmercury-Induced Myotoxicity in Drosophila.Front Genet. 2018 Jan 15;8:233. doi: 10.3389/fgene.2017.00233. eCollection 2017. Front Genet. 2018. PMID: 29379520 Free PMC article.
-
Methylmercury and diphenyl diselenide interactions in Drosophila melanogaster: effects on development, behavior, and Hg levels.Environ Sci Pollut Res Int. 2018 Aug;25(22):21568-21576. doi: 10.1007/s11356-018-2293-7. Epub 2018 May 21. Environ Sci Pollut Res Int. 2018. PMID: 29785592
References
-
- Agaisse H, Petersen UM, Boutros M, Mathey-Prevot B, Perrimon N. Signaling role of hemocytes in Drosophila JAK/STAT-dependent response to septic injury. Dev. Cell. 2003;5:441–450. - PubMed
-
- Ashok Y. Drosophila toll pathway: the new model. Sci. Signal. 2009;2(52):jc1. - PubMed
-
- Ballatori N, Clarkson TW. Biliary transport of glutathione and methylmercury. Am. J. Physiol. 1983;244:G435–G441. - PubMed
-
- Belles-Isles M, Ayotte P, Dewailly E, Weber JP, Roy R. Cord blood lymphocyte functions in newborns from a remote maritime population exposed to organochlorines and methylmercury. J. Toxicol. Environ. Health. 2002;65:165–182. - PubMed
-
- Benjamin Y, Hochberg Y. Controlling the false discovery rate: a practical and powerful approach to multiple testing. J. R. Stat. Soc. 1995;B57:289–300.
Publication types
MeSH terms
Substances
Grants and funding
LinkOut - more resources
Full Text Sources
Molecular Biology Databases
