. 2010 Jul;116(1):249-63.
doi: 10.1093/toxsci/kfq111. Epub 2010 Apr 7.

Lead exposure during synaptogenesis alters vesicular proteins and impairs vesicular release: potential role of NMDA receptor-dependent BDNF signaling

Affiliations

Lead exposure during synaptogenesis alters vesicular proteins and impairs vesicular release: potential role of NMDA receptor-dependent BDNF signaling

April P Neal et al. Toxicol Sci. 2010 Jul.

Abstract

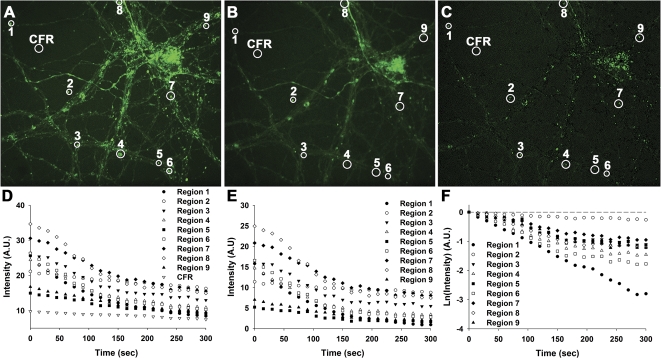
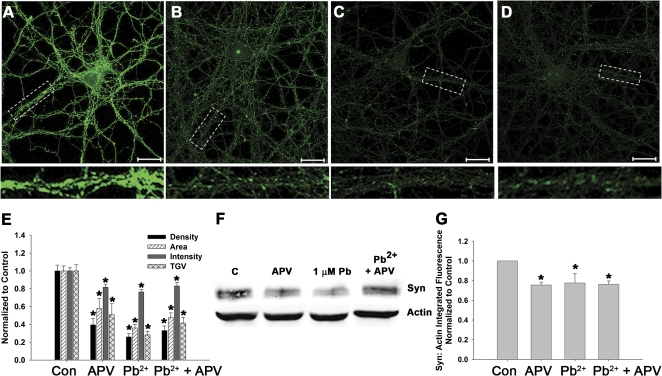
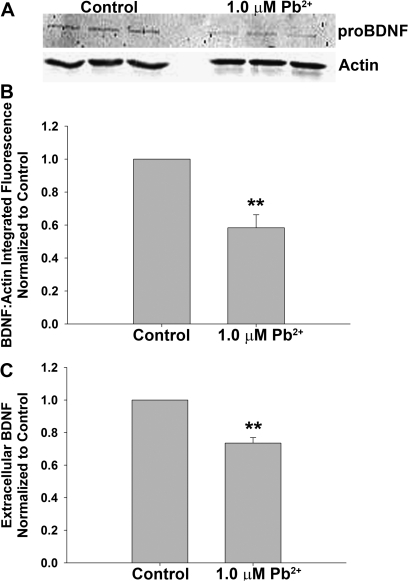
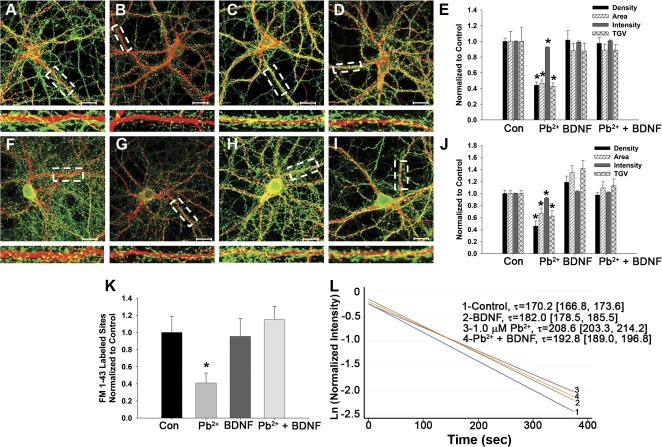
Lead (Pb(2+)) exposure is known to affect presynaptic neurotransmitter release in both in vivo and cell culture models. However, the precise mechanism by which Pb(2+) impairs neurotransmitter release remains unknown. In the current study, we show that Pb(2+) exposure during synaptogenesis in cultured hippocampal neurons produces the loss of synaptophysin (Syn) and synaptobrevin (Syb), two proteins involved in vesicular release. Pb(2+) exposure also increased the number of presynaptic contact sites. However, many of these putative presynaptic contact sites lack Soluble NSF attachment protein receptor complex proteins involved in vesicular exocytosis. Analysis of vesicular release using FM 1-43 dye confirmed that Pb(2+) exposure impaired vesicular release and reduced the number of fast-releasing sites. Because Pb(2+) is a potent N-methyl-D-aspartate receptor (NMDAR) antagonist, we tested the hypothesis that NMDAR inhibition may be producing the presynaptic effects. We show that NMDAR inhibition by aminophosphonovaleric acid mimics the presynaptic effects of Pb(2+) exposure. NMDAR activity has been linked to the signaling of the transsynaptic neurotrophin brain-derived neurotrophic factor (BDNF), and we observed that both the cellular expression of proBDNF and release of BDNF were decreased during the same period of Pb(2+) exposure. Furthermore, exogenous addition of BDNF rescued the presynaptic effects of Pb(2+). We suggest that the presynaptic deficits resulting from Pb(2+) exposure during synaptogenesis are mediated by disruption of NMDAR-dependent BDNF signaling.


Figures

FIG. 1.
FIG. 1.
Representation of data analysis used in live imaging experiments with FM 1-43 dye. (A) FM 1-43 staining of a control neuron at the start of 5 min of imaging. Regions later analyzed for FM 1-43 release are shown in white circles including one area in a cell-free region (CFR) tracked to estimate the rate of photobleaching in the sample. (B) The same neuron after the destaining process. (C) Subtracting the destained image (B) from the initial time point (A) results in identification of sites, which have released dye during the imaging period. Sites present in both (A) and (B) that are not present in (C), such as region 2, are sites that did not release dye during the imaging process. (D) Release of dye from the sites shown in (A) and (C), including the CFR, during 300 s of recording. (E) Data from (D) after subtracting the rate of photobleaching derived from the CFR. (F) Data from (E) linearized by taking the natural log of the intensity after normalizing each site to its initial fluorescence. Validation of our methodology is shown here, as the nonreleasing site (region 2) does not exhibit dye release.
FIG. 2.
FIG. 2.
Pb2+ exposure during synaptogenesis reduces synaptophysin expression in a concentration-dependent manner. (A–D) Representative images of neurons exposed to 0 (A), 0.01 μM Pb2+ (B), 0.1 μM Pb2+ (C), and 1.0 μM Pb2+ (D) for 5 days. Scale bar = 20 μm; dendritic regions enclosed by dashed rectangle shown magnified to right of image. (E) Quantification of Syn immunofluorescent parameters (see the “Methods” section for descriptions). Syn puncta density, area, intensity, and TGV decreased significantly after exposure to Pb2+. Data are represented as the mean ± SEM and are the result of three independent trials with five to six neurons per condition per trial. *p < 0.05 relative to control (F) Representative Western blot of neuron cultures treated with 0–1.0μM Pb2+ probed for Syn and actin. (G) Quantification of Western blots. Data are shown as the mean ± SEM and are the result of four independent trials. *p < 0.05 relative to control
FIG. 3.
FIG. 3.
Pb2+ exposure results in decreased levels of selective vesicular proteins. (A–C) Representative images of control (A) and 1μM Pb2+-treated (B) neurons stained for Syb (green) and MAP2 (red). (C) Quantification of immunofluorescence parameters. Syb puncta density, area, intensity, and TGV decreased significantly after Pb2+ exposure. This may indicate impairment of vesicular release because Syb plays an important role in vesicular release mechanisms. (D–F) Representative images of control (D) and 1μM Pb2+-treated (E) neurons stained for Syt (green) and MAP2 (red). (F) Quantification of immunofluorescence parameters. No effect on Syt levels was seen after Pb2+ exposure. (G–I) Representative images of control (G) and 1μM Pb2+-treated (H) neurons stained for VGLUT1 (green) and MAP2 (red). (I) Quantification of immunofluorescence parameters. Pb2+ exposure did not affect the expression of VGLUT1, indicating that Pb2+ did not affect the number of glutamatergic inputs or transporter levels. (J–L) Representative images of control (J) and 1μM Pb2+-treated (K) neurons stained for VGAT. (L) Quantification of immunofluorescence parameters. Although puncta density does not change, indicating no difference in GABAergic sites, puncta area and TGV decreased after Pb2+ exposure. This suggests that although there are similar levels of GABA synapses after Pb2+ exposure, these synapses may contain lower VGAT levels. (M–O) Representative images of control (M) and 1μM Pb2+-treated (N) neurons stained for Bass (green) and MAP2 (red). (O) Quantification of immunofluorescence parameters. In contrast to Syn and Syb, Bass puncta density increased significantly after Pb2+ exposure, suggesting an increase in putative presynaptic contact sites. All data are shown as the mean ± SEM and are the result of at least three independent trials with three to six neurons per condition per trial. *p < 0.05 relative to control (Student’s t-test). Scale bar = 20 μm; dendritic regions enclosed by dashed rectangle shown magnified to right of image.
FIG. 4.
FIG. 4.
Effect of Pb2+ exposure on the colocalization of the presynaptic vesicular protein Syn with the presynaptic structural protein Bassoon and glutamatergic and GABAergic vesicular transporters. (A–C) Representative images of control (A) and 1μM Pb2+-treated (B) neurons stained for Bass (red) and Syn (green). Colocalization quantification is shown in (C) Syn + Bass corresponds to the amount of Bass found with Syn-containing synapses, Bass + Syn corresponds to the amount of Syn found in Bass-containing synapses, and Bass alone corresponds to the amount of Bass found in absence of Syn. (D–F) Representative images of control (D) and 1μM Pb2+-treated (E) neurons stained for VGLUT1 (red) and Syn (green). Colocalization quantification is shown in (F) Syn + VGLUT1 corresponds to the amount of VGLUT1 found with Syn-containing synapses, VGLUT1 + Syn corresponds to the amount of Syn found in VGLUT1-containing synapses, and VGLUT1 alone corresponds to the amount of VGLUT1 found in absence of Syn. (G–I) Representative images of control (G) and 1μM Pb2+-treated (H) neurons stained for VGAT (red) and Syn (green). Colocalization quantification is shown in (I) Syn + VGAT corresponds to the amount of VGAT found with Syn-containing synapses, VGAT + Syn corresponds to the amount of Syn found in VGAT-containing synapses, and VGAT alone corresponds to the amount of VGAT found in absence of Syn. Data are represented as the mean ± SEM of at least three independent trials with four to five neurons per condition per trial. *p < 0.05; **p < 0.01 compared with control (Student’s two-tailed t-test). Scale bar = 20 μm; dendritic regions enclosed by dashed rectangle shown magnified below image.
FIG. 5.
FIG. 5.
Pb2+ exposure decreases the number of vesicular release sites labeled with FM 1-43 and reduces the average rate of release. (A) Pb2+ exposure reduces the number of sites stained with FM 1-43 at the start of recording. Data are shown as mean ± SEM and are the result of three independent trials with three to four neurons per condition per trial. **p < 0.01 (Student’s two-tailed t-test). (B) Averaged rate of release for control and 1μM Pb2+-treated neurons. All release sites were normalized to their initial fluorescence and pooled. The averaged rate of release determined by mixed-effect linear regression is shown superimposed over the pooled data. Pb2+ significantly slowed the overall rate of release relative to control conditions (p < 0.0001, mixed-effect linear regression, xtmixed in Stata v9.2). Predicted values of τ are shown with 95% confidence intervals.
FIG. 6.
FIG. 6.
NMDAR inhibition results in decreased Syn levels. Neurons were exposed to 100μM APV, 1μM Pb2+, or both for 5 days (DIV7–DIV12) (A–D) Representative images of control (A), 100μM APV-treated (B), 1μM Pb2+-treated (C), and Pb2+ + APV-treated (D) neurons stained for Syn (green). Scale bar = 20 μm; dendritic regions enclosed by dashed rectangle shown magnified below image. (E) Syn immunofluorescence parameters. Syn puncta density, area, intensity, and TGV are reduced after all three treatments. Data are represented as the mean ± SEM and are the result of three independent trials with four to six neurons per treatment per trial. (F–G) Representative immunoblot of whole-cell protein probed for Syn and actin (F). Quantification in (G). Syn protein levels are decreased after all three treatments. Data are represented as the mean ± SEM and are the result of three independent trials. *p < 0.05 compared with control (Fisher’s protected LSD).
FIG. 7.
FIG. 7.
Pb2+ exposure during synaptogenesis reduces cellular levels of proBDNF protein and also reduces the amount of BDNF released from neurons. (A) Representative Western blot of cellular proBDNF and actin levels in control and 1.0μM Pb2+-treatened neurons from one independent trial performed in triplicate. (B) Quantification of (A). **p < 0.01 by Student’s t-test. Data are shown as the mean ± SEM and are the results of five independent trials. (C) Pb2+ exposure reduces the amount of BDNF found in the neuron culture medium determined by ELISA. **p < 0.01 by Student’s t-test. Data are shown as the mean ± SEM and are the results of three independent trials.
FIG. 8.
FIG. 8.
Exogenous addition of BDNF for the final 24 h of Pb2+ exposure is sufficient to recover Syn, Syb, and presynaptic vesicular release. Neurons were exposed to Pb2+ as described above but 25 ng/ml BDNF was added for the final 24 h of Pb2+ exposure. (A–E) Representative images of control (A), 1μM Pb2+-treated (B), 25 ng/ml BDNF-treated (C), and Pb2+ + BDNF-treated (D) neurons stained for Syn (green) and MAP2 (red). (E) Quantification of Syn puncta characteristics. Twenty-five nanograms per milliliter was sufficient to completely recover Syn puncta density, intensity, area, and TGV. Data are shown as the mean ± SEM for four independent trials with four to six neurons per condition per trial. (F–J) Representative images of control (F), 1μM Pb2+-treated (G) 25 ng/ml BDNF-treated (H), and Pb2+ + BDNF-treated (I) neurons stained for Syb (green) and MAP2 (red). (E) Quantification of Syb puncta characteristics. Twenty-five nanograms per milliliter was sufficient to completely recover Syb puncta density, intensity, area, and TGV. Data are shown as the mean ± SEM for four independent trials with four to six neurons per condition per trial. (K) Exogenous addition of BDNF for the final 24 h of Pb2+ exposure was sufficient to recover the number of vesicular release sites labeled with FM 1-43 at time = 0 during live imaging. (L) Averaged rate of release for control, BDNF, 1μM Pb2+, and Pb2+ + BDNF-treated neurons. All sites were normalized to their initial fluorescence and pooled. All treatments were significantly slower than the control condition (p < 0.0001), but the neurons treated with both BDNF and Pb2+ exhibited a significantly faster rate of release than those treated with Pb2+ alone. Predicted value of τ shown with 95% confidence intervals (xtmixed, Stata v9.2). *Different from all other treatments (p < 0.05, Fisher’s protected LSD). Scale bar = 20 μm; dendritic regions enclosed by dashed rectangle shown magnified below image.

Similar articles

Cited by

References

    1. Alkondon M, Costa ACS, Radhakrishnan V, Aronstam RS, Albuquerque EX. Selective blockade of NMDA-activated channel currents may be implicated in learning deficits caused by lead. FEBS Lett. 1990;261:124–130. - PubMed
    1. Bouton CMLS, Frelin LP, Forde CE, Godwin HA, Pevsner J. Synaptotagmin I is a molecular target for lead. J. Neurochem. 2001;76:1724–1735. - PubMed
    1. Braga MFM, Pereira EFR, Albuquerque EX. Nanomolar concentrations of lead inhibit glutamatergic and GABAergic transmission in hippocampal neurons. Brain Res. 1999;826:22–34. - PubMed
    1. Bramham CR, Messaoudi E. BDNF function in adult synaptic plasticity: the synaptic consolidation hypothesis. Prog. Neurobiol. 2005;76:99–125. - PubMed
    1. Bretou M, Anne C, Darchen F. A fast mode of membrane fusion dependent on tight SNARE zippering. J. Neurosci. 2008;28:8470–8476. - PMC - PubMed

Publication types

MeSH terms

Substances