. 2010 Jul;116(1):44-57.
doi: 10.1093/toxsci/kfq106. Epub 2010 Apr 7.

Monomethylarsonous acid produces irreversible events resulting in malignant transformation of a human bladder cell line following 12 weeks of low-level exposure

Affiliations

Monomethylarsonous acid produces irreversible events resulting in malignant transformation of a human bladder cell line following 12 weeks of low-level exposure

Shawn M Wnek et al. Toxicol Sci. 2010 Jul.

Abstract

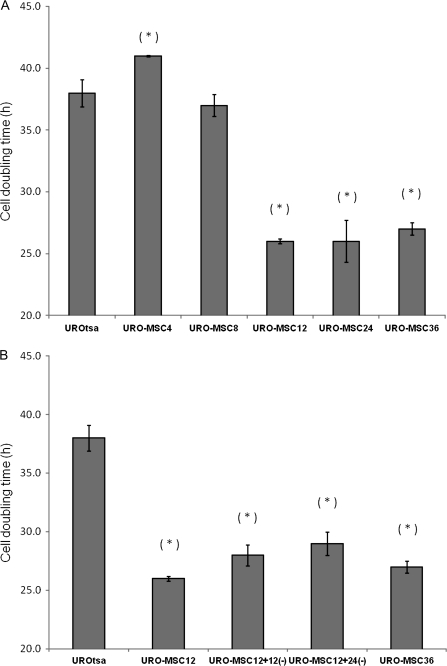
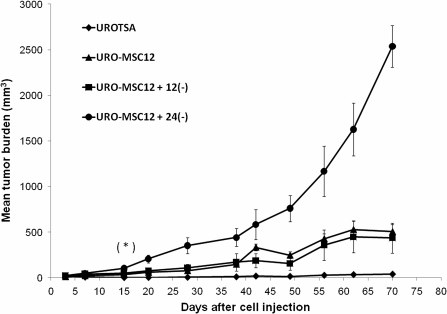
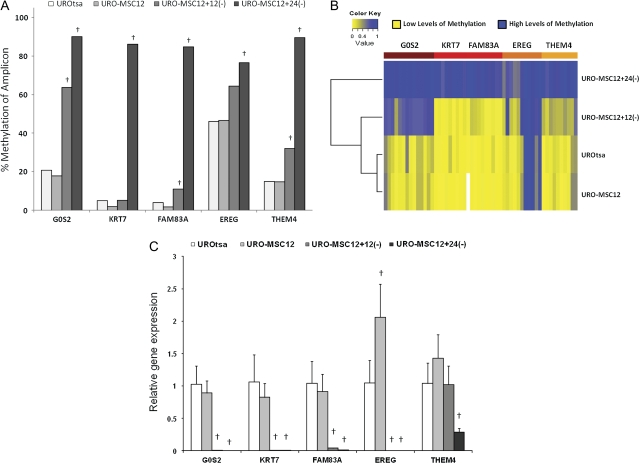
Arsenic is a known human bladder carcinogen; however, the mechanisms underlying arsenical-induced bladder carcinogenesis are not understood. Previous research has demonstrated that exposure of a nontumorigenic human urothelial cell line, UROtsa, to 50 nM monomethylarsonous acid (MMA(III)) for 52 weeks resulted in malignant transformation. To focus research on the early mechanistic events leading to MMA(III)-induced malignancy, the goal of this research was to resolve the critical period in which continuous MMA(III) exposure (50 nM) induces the irreversible malignant transformation of UROtsa cells. An increased growth rate of UROtsa cells results after 12 weeks of MMA(III) exposure. Anchorage-independent growth occurred after 12 weeks with a continued increase in colony formation when 12-week exposed cells were cultured for an additional 12 or 24 weeks without MMA(III) exposure. UROtsa cells as early as 12 weeks MMA(III) exposure were tumorigenic in severe combined immunodeficiency mice with tumorigenicity increasing when 12-week exposed cells were cultured for an additional 12 or 24 weeks in the absence of MMA(III) exposure. To assess potential underlying mechanisms associated with the early changes that occur during MMA(III)-induced malignancy, DNA methylation was assessed in known target gene promoter regions. Although DNA methylation remains relatively unchanged after 12 weeks of exposure, aberrant DNA methylation begins to emerge after an additional 12 weeks in culture and continues to increase through 24 weeks in culture without MMA(III) exposure, coincident with the progression of a tumorigenic phenotype. Overall, these data demonstrate that 50 nM MMA(III) is capable of causing irreversible malignant transformation in UROtsa cells after 12 weeks of exposure. Having resolved an earlier timeline in which MMA(III)-induced malignant transformation occurs in UROtsa cells will allow for mechanistic studies focused on the critical biological changes taking place within these cells prior to 12 weeks of exposure, providing further evidence about potential mechanisms of MMA(III)-induced carcinogenesis.


Figures

FIG. 1.
FIG. 1.
Cell doubling times following exposure to MMAIII. (a) Comparison of cell doubling times of UROtsa control cells and UROtsa cells continuously exposed to 50nM MMAIII. A significant decrease in cell doubling time is first demonstrated after UROtsa cells are exposed to 50nM MMAIII for 12 weeks (URO-MSC12) and doubling times remain decreased with prolonged continuous exposure to 50nM MMAIII through 24 and 36 weeks exposure (URO-MSC24 and URO-MSC36, respectively). (b) Comparison of cell doubling time of UROtsa cells exposed to 50nM MMAIII for 12 weeks (URO-MSC12) and 12-week MMAIII-exposed UROtsa cells cultured for an additional 12 or 24 weeks without MMAIII exposure (URO-MSC12+12(–) and URO-MSC12+24(–), respectively). Cell doubling times remain decreased compared with parental UROtsa in URO-MSC12+12(–) and URO-MSC12+24(–) cells despite the removal of previous MMAIII exposure. “*” Marks statistically significant difference (p ≤ 0.05) between MMAIII-exposed UROtsa variants (URO-MSC#) and untreated UROtsa control determined using Student's t-test.
FIG. 2.
FIG. 2.
Cell diameter changes following exposure to MMAIII. Average cell diameter (microns) of untreated UROtsa control and UROtsa cells exposed to 50nM MMAIII for 4, 8, 12, 24, and 36 weeks (URO-MSC4, URO-MSC8, URO-MSC12, URO-MSC24, URO-MSC36, respectively) and 12-week exposed UROtsa cells with an additional cell culturing without MMAIII for 12 and 24 weeks (URO-MSC12+12(–) and URO-MSC12+24(–), respectively). Increase in cell diameter is significantly elevated following 4 weeks exposure to MMAIII and remains significantly elevated with prolonged exposure to MMAIII through 36 weeks. “*” Marks statistically significant difference (p ≤ 0.05) between MMAIII-exposed UROtsa variants (URO-MSC#) and untreated UROtsa control determined using Student's t-test.
FIG. 3.
FIG. 3.
Anchorage-independent growth following exposure to MMAIII. (a) Anchorage-independent growth of UROtsa cells following 4, 8, 12, 16, 20, 24, and 36 weeks exposure to 50nM MMAIII (URO-MSC4, URO-MSC8, URO-MSC12, URO-MSC16, URO-MSC20, URO-MSC24 and URO-MSC36, respectively). No colony formation was detected in UROtsa cells after 4- or 8-week MMAIII exposure. (b) Comparison of anchorage-independent growth of URO-MSC cells in the presence or following removal of previous exposure to MMAIII. Graphs depict colony growth after 14 days incubation in soft agar. Within each well, 5 randomly selected microscope fields were selected and colonies were manually counted from each of the wells (n = 5). “*” Marks statistically significant difference (p ≤ 0.05) using Student's t-test. “†” Marks statistically significant change in the number of colonies formed between MMAIII-exposed UROtsa variants (URO-MSC#) and untreated UROtsa control identified with ANOVA followed by Bonferroni's multiple comparison test; p ≤ 0.05 was considered statistically significant. Error bars within each column represent ± SEM.
FIG. 4.
FIG. 4.
Tumorigenicity of MMAIII-exposed UROtsa variants and untreated UROtsa control in SCID mice. UROtsa, URO-MSC12, and 12-week MMAIII-exposed UROtsa cells cultured in the absence of MMAIII for 12 or 24 weeks (URO-MSC12+12(–) or URO-MSC12+24(–), respectively) were injected into SCID mice and allowed to grow for 10 weeks to assess tumorigenicity. Tumor volumes were measured twice weekly and data represents tumor volume (mm3) per time (days postinjection). Mean tumor burden represents the average tumor volume of four independent experiments (n = 4). Significant changes in tumor volume were identified with ANOVA followed by Bonferroni's multiple comparisons test. Statistically significant (p ≤ 0.05) differences in tumor volume of URO-MSC12, URO-MSC12+12(–), and URO-MSC12+24(–) compared with untreated UROtsa control were identified 15 days after injection for each of the MMAIII-exposed cell lines. Error bars indicate the SEM at each time point for each cell line. Error bars of untreated UROtsa control are too small to visualize.
FIG. 5.
FIG. 5.
MMAIII-mediated differential DNA methylation in UROtsa cells. (a) Bar chart of MassARRAY data identified MMAIII-mediated differential DNA methylation. DNA methylation levels in parental UROtsa cells and each of the MMAIII-exposed cell lines (URO-MSC12, URO-MSC12+12(–), URO-MSC12+24(–)) were assessed in five differentially methylated gene promoter regions using Sequenom MassARRAY. The values presented show the average percent CpG methylation of CpG fragments analyzed for each promoter region. “†” Marks statistically significant increase in percent methylation of amplicon when compared with control UROtsa (p ≤ 0.05). (b) Heatmap of MassARRAY data shows MMAIII-mediated differential DNA methylation. The heatmap shows the level of cytosine methylation within the individual CpG units on x-axis with yellow representing low levels of methylation and blue representing high levels. Unsupervised hierarchical clustering along the left side shows the progression of DNA methylation is able to discriminate and correctly classify the increasing tumorigenic potential of UROtsa cells to URO-MSC12+24(–) cells. Colors within the top bar represent each of the promoter regions analyzed. (c) Decreased gene expression is linked to MMAIII-mediated aberrant DNA hypermethylation of the target gene promoters. Quantitative real-time RT-PCR was performed with n = 3 from parental UROtsa and each of the MMAIII-exposed variants. “†” Marks statistically significant change in transcript level when compared with control UROtsa (p ≤ 0.05). Values shown are relative to GAPDH normalized to UROtsa.
FIG. 6.
FIG. 6.
Assessment of specific biomarkers of invasive bladder cancer in UROtsa cells following 50nM MMAIII exposure. (a) Quantitative real-time RT-PCR expression of COX-2 mRNA normalized to UROtsa and relative to GAPDH in parental UROtsa and MMAIII-exposed UROtsa variants. “*” Marks statistically significant increase/decrease in transcript level when compared with control UROtsa (p ≤ 0.05); n = 3 for all treatment groups. (b) COX-2 protein expression of parental UROtsa cells and MMAIII-exposed UROtsa variants. Incubation of UROtsa cells with lipopolysaccharide (10 μg/ml) for 6 h was utilized as a positive control for the induction of COX-2. “*” Marks statistically significant increase/decrease in protein levels when compared with control UROtsa (p ≤ 0.05); n = 6 for all treatment groups. (c) Quantitative real-time RT-PCR expression of DBC1 mRNA normalized to UROtsa and relative to GAPDH in parental UROtsa and MMAIII-exposed UROtsa variants. “*” Marks statistically significant decrease in transcript level when compared with control UROtsa (p ≤ 0.05); n = 3 for all treatment groups.

Similar articles

Cited by

References

    1. Achanzar WE, Brambila EM, Diwan BA, Webber MM, Waalkes MP. Inorganic arsenite-induced malignant transformation of human prostate epithelial cells. J. Natl. Cancer Inst. 2002;94:1888–1891. - PubMed
    1. Aposhian HV, Gurzau ES, Le XC, Gurzau A, Healy SM, Lu X, Ma M, Yip Li, Zakharyan RA, Maiorina RM, et al. Occurrence of monomethylarsonous acid in urine of humans exposed to inorganic arsenic. Chem. Res. Toxicol. 2000;13:693–697. - PubMed
    1. Benbrahim-Tallaa L, Waterland RA, Styblo M, Achanzar WE, Webber MM, Waalkes MP. Molecular events associated with arsenic-induced malignant transformation of human prostatic epithelial cells: aberrant genomic DNA methylation and K-ras oncogene activation. Toxicol. Appl. Pharmacol. 2005;206:288–298. - PubMed
    1. Bredfeldt TG, Jagadish B, Eblin KE, Mash EA, Gandolfi AJ. Monomethylarsonous acid induced transformation of human bladder cells. Toxicol. Appl. Pharmacol. 2006;216:69–79. - PMC - PubMed
    1. Bredfeldt TG, Kopplin MJ, Gandolfi AJ. Effects of arsenite on UROtsa cells: low-level arsenite causes accumulation of ubiquitinated proteins that is enhanced by reduction in cellular glutathione levels. Toxicol. Appl. Pharmacol. 2004;198:412–418. - PubMed

Publication types

Substances