Involvement of the cytoskeleton in controlling leading-edge function during chemotaxis
- PMID: 20375144
- PMCID: PMC2877640
- DOI: 10.1091/mbc.e10-01-0009
Involvement of the cytoskeleton in controlling leading-edge function during chemotaxis
Abstract
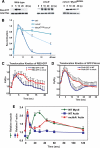
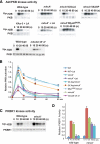
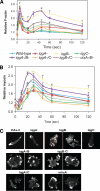
In response to directional stimulation by a chemoattractant, cells rapidly activate a series of signaling pathways at the site closest to the chemoattractant source that leads to F-actin polymerization, pseudopod formation, and directional movement up the gradient. Ras proteins are major regulators of chemotaxis in Dictyostelium; they are activated at the leading edge, are required for chemoattractant-mediated activation of PI3K and TORC2, and are one of the most rapid responders, with activity peaking at approximately 3 s after stimulation. We demonstrate that in myosin II (MyoII) null cells, Ras activation is highly extended and is not restricted to the site closest to the chemoattractant source. This causes elevated, extended, and spatially misregulated activation of PI3K and TORC2 and their effectors Akt/PKB and PKBR1, as well as elevated F-actin polymerization. We further demonstrate that disruption of specific IQGAP/cortexillin complexes, which also regulate cortical mechanics, causes extended activation of PI3K and Akt/PKB but not Ras activation. Our findings suggest that MyoII and IQGAP/cortexillin play key roles in spatially and temporally regulating leading-edge activity and, through this, the ability of cells to restrict the site of pseudopod formation.
Figures


Similar articles
-
Dynamic localization of the actin-bundling protein cortexillin I during cell migration.Mol Cells. 2011 Sep;32(3):281-7. doi: 10.1007/s10059-011-0072-0. Epub 2011 Jun 23. Mol Cells. 2011. PMID: 21710202 Free PMC article.
-
Ras-mediated activation of the TORC2-PKB pathway is critical for chemotaxis.J Cell Biol. 2010 Jul 26;190(2):233-45. doi: 10.1083/jcb.201001129. J Cell Biol. 2010. PMID: 20660630 Free PMC article.
-
An endogenous chemorepellent directs cell movement by inhibiting pseudopods at one side of cells.Mol Biol Cell. 2019 Jan 15;30(2):242-255. doi: 10.1091/mbc.E18-09-0562. Epub 2018 Nov 21. Mol Biol Cell. 2019. PMID: 30462573 Free PMC article.
-
Regulation of chemotaxis by the orchestrated activation of Ras, PI3K, and TOR.Eur J Cell Biol. 2006 Sep;85(9-10):873-95. doi: 10.1016/j.ejcb.2006.04.007. Epub 2006 Jun 5. Eur J Cell Biol. 2006. PMID: 16740339 Review.
-
Leading the way: Directional sensing through phosphatidylinositol 3-kinase and other signaling pathways.J Cell Sci. 2003 Sep 1;116(Pt 17):3471-8. doi: 10.1242/jcs.00703. J Cell Sci. 2003. PMID: 12893811 Review.
Cited by
-
Actin cross-linking proteins cortexillin I and II are required for cAMP signaling during Dictyostelium chemotaxis and development.Mol Biol Cell. 2012 Jan;23(2):390-400. doi: 10.1091/mbc.E11-09-0764. Epub 2011 Nov 23. Mol Biol Cell. 2012. PMID: 22114350 Free PMC article.
-
Dynamic localization of the actin-bundling protein cortexillin I during cell migration.Mol Cells. 2011 Sep;32(3):281-7. doi: 10.1007/s10059-011-0072-0. Epub 2011 Jun 23. Mol Cells. 2011. PMID: 21710202 Free PMC article.
-
Akt3 kinase suppresses pinocytosis of low-density lipoprotein by macrophages via a novel WNK/SGK1/Cdc42 protein pathway.J Biol Chem. 2017 Jun 2;292(22):9283-9293. doi: 10.1074/jbc.M116.773739. Epub 2017 Apr 7. J Biol Chem. 2017. PMID: 28389565 Free PMC article.
-
Contractility kits promote assembly of the mechanoresponsive cytoskeletal network.J Cell Sci. 2019 Jan 16;132(2):jcs226704. doi: 10.1242/jcs.226704. J Cell Sci. 2019. PMID: 30559246 Free PMC article.
-
IQGAP-related protein IqgC suppresses Ras signaling during large-scale endocytosis.Proc Natl Acad Sci U S A. 2019 Jan 22;116(4):1289-1298. doi: 10.1073/pnas.1810268116. Epub 2019 Jan 8. Proc Natl Acad Sci U S A. 2019. PMID: 30622175 Free PMC article.
References
-
- Bensenor L. B., Kan H. M., Wang N., Wallrabe H., Davidson L. A., Cai Y., Schafer D. A., Bloom G. S. IQGAP1 regulates cell motility by linking growth factor signaling to actin assembly. J. Cell Sci. 2007;120:658–669. - PubMed
-
- Bosgraaf L., Van Haastert P. J. The regulation of myosin II in Dictyostelium. Eur. J. Cell Biol. 2006;85:969–979. - PubMed
Publication types
MeSH terms
Substances
Grants and funding
LinkOut - more resources
Full Text Sources
Other Literature Sources
Molecular Biology Databases
Miscellaneous

