. 2010 Jun 1;21(11):1872-84.
doi: 10.1091/mbc.e09-09-0839. Epub 2010 Apr 7.

Chromatin environment of histone variant H3.3 revealed by quantitative imaging and genome-scale chromatin and DNA immunoprecipitation

Affiliations

Chromatin environment of histone variant H3.3 revealed by quantitative imaging and genome-scale chromatin and DNA immunoprecipitation

Erwan Delbarre et al. Mol Biol Cell. .

Erratum in

  • Mol Biol Cell. 2010 Nov;21(21):3759

Abstract

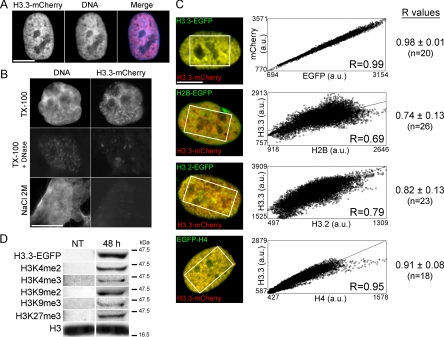
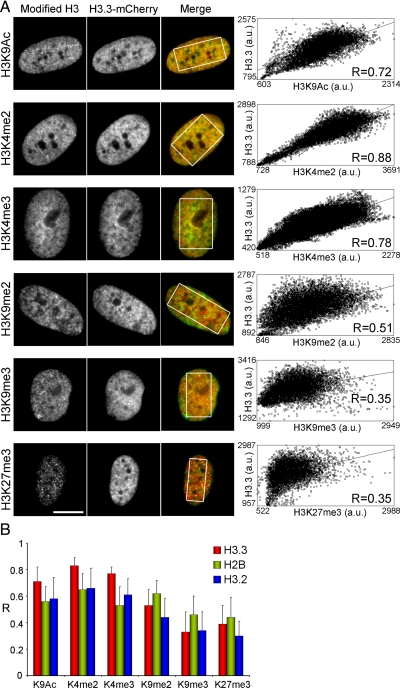
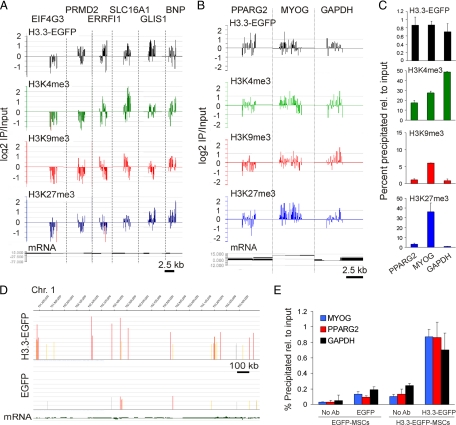
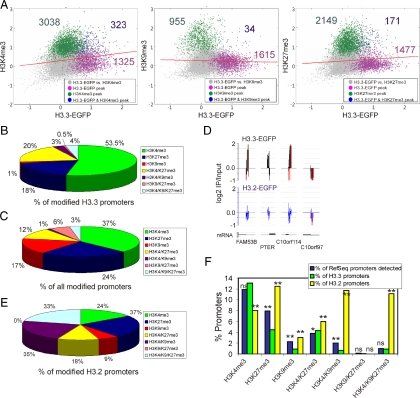
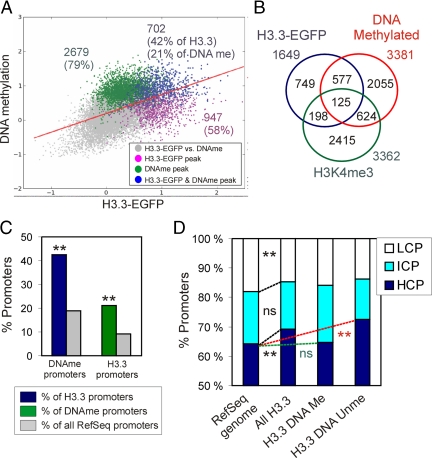
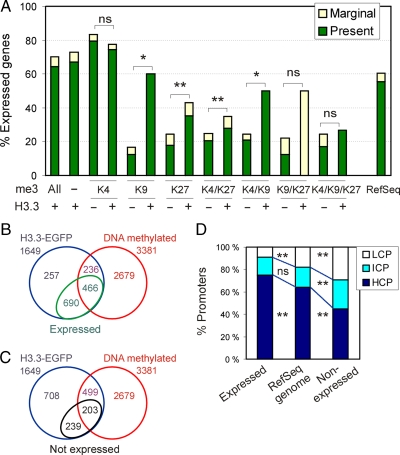
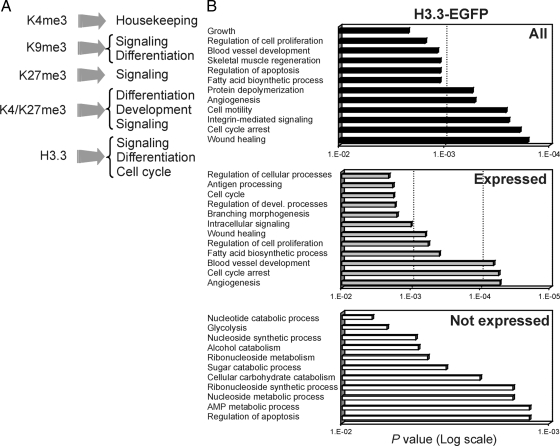
In contrast to canonical histones, histone variant H3.3 is incorporated into chromatin in a replication-independent manner. Posttranslational modifications of H3.3 have been identified; however, the epigenetic environment of incorporated H3.3 is unclear. We have investigated the genomic distribution of epitope-tagged H3.3 in relation to histone modifications, DNA methylation, and transcription in mesenchymal stem cells. Quantitative imaging at the nucleus level shows that H3.3, relative to replicative H3.2 or canonical H2B, is enriched in chromatin domains marked by histone modifications of active or potentially active genes. Chromatin immunoprecipitation of epitope-tagged H3.3 and array hybridization identified 1649 H3.3-enriched promoters, a fraction of which is coenriched in H3K4me3 alone or together with H3K27me3, whereas H3K9me3 is excluded, corroborating nucleus-level imaging data. H3.3-enriched promoters are predominantly CpG-rich and preferentially DNA methylated, relative to the proportion of methylated RefSeq promoters in the genome. Most but not all H3.3-enriched promoters are transcriptionally active, and coenrichment of H3.3 with repressive H3K27me3 correlates with an enhanced proportion of expressed genes carrying this mark. H3.3-target genes are enriched in mesodermal differentiation and signaling functions. Our data suggest that in mesenchymal stem cells, H3.3 targets lineage-priming genes with a potential for activation facilitated by H3K4me3 in facultative association with H3K27me3.


Figures

Figure 1.
Figure 1.
Incorporation of epitope-tagged H3.3 into chromatin in human primary cells. (A) Intranuclear distribution of H3.3-mCherry 168 h after transient transfection. DNA was labeled with DAPI. (B) Cells expressing H3.3-EGFP were extracted with 0.1% Triton X-100, 0.1% Triton X-100 and 1 mg/ml DNase I, or 2 M NaCl before fixation and DAPI staining. (C) Correlation analysis of colocalization of H3.3-mCherry with H3.3-EGFP, H2B-EGFP, H3.2-EGFP, and EGFP-H4. Scatter plots show for each cell illustrated on the left, pixel distribution whereby the intensity of a given pixel in the green image corresponds to the x-coordinate, and the intensity of the corresponding pixel in the red image is shown as the y-coordinate. Correlation was done in the area delineated on the images. Correlation coefficients (R) of overlaps between H3.3-mCherry and H3.3-EGFP, H2B-EGFP, H3.2-EGFP or EGFP-H4 are also shown for all cells (n, number of cells analyzed). (D) Western blot analysis of indicated posttranslational modifications on overexpressed H3.3-EGFP in HeLa cells. NT, nontransfected cells; 48 h, H3.3-EGFP-expressing cells 48 h posttransfection. Endogenous H3 was probed as a loading control (see Supplemental Figure S1).
Figure 2.
Figure 2.
H3.3 preferentially incorporates into chromatin domains marked by histone modifications of active genes. (A) Colocalization analysis of overlap between H3.3-mCherry and immunolabeled modified histones in MSCs. Correlation coefficients (R) of overlaps were determined in individual cells as in Figure 1C, as shown on the graphs (each graph is for a single cell). (B) Average ± SD of correlation coefficients (R values) of H3.3-mCherry and H3 modification immunolabeling overlaps for each H3 modification in MSCs (n = 40–56 cells). R values for modified H3 and either H2B-diHcRed (21–35 cells) or H3.2-mCherry (n = 24–56 cells) overlaps are also shown. Bars, 10 μm.
Figure 3.
Figure 3.
H3.3-EGFP ChIP-on-chip validation on target promoters. (A) Combinatorial enrichment profiles detected by ChIP-on-chip for H3.3-EGFP, H3K4me3, H3K9me3, and H3K27me3 on the promoters of indicated genes. (B and C) H3.3-EGFP, H3K4me3, H3K9me3, and H3K27me3 profiles on the PPARG2, MYOG, and GAPDH promoters determined by ChIP-on-chip (B) and ChIP-qPCR 9C). (D) EGFP ChIP-on-chip peak detection (FDR ≤ 0.1) in a 1.7-Mb segment of chromosome 1 in sorted H3.3-EGFP-expressing cells (top track) and control EGFP-expressing cells (bottom track). (E) ChIP-qPCR analysis of control EGFP (left) and H3.3-EGFP (right) enrichment on indicated promoters (data from 4 independent ChIPs each analyzed by duplicate qPCRs).
Figure 4.
Figure 4.
H3.3-EGFP associates with promoters enriched in H3K4me3 but not H3K9me3. (A) Two-dimensional scatter plots of MaxTen values for log2 IP/Input ratios for H3.3-EGFP versus H3K4me3 (left), H3K9me3 (middle), and H3K27me3 (right). MaxTen values are the average of both ChIP-on-chip replicates for each condition. Data points were colored to indicate classification according to peak calling, to show promoters enriched in H3.3-EGFP (purple); H3K4me3, H3K9me3, or H3K27me3 (green); or H3.3-EGFP together with either modification (blue). Red bars show regression lines for all points. (B) Proportions of modified H3.3-EGFP promoters enriched in indicated histone modifications. (C) Proportions of all modified RefSeq promoters enriched in indicated histone modifications. (D) Representative profiles of H3.3-EGFP and H3.2-EGFP occupancy on selected promoters on chromosome 10; red bars reflect out-of-scale signals. (E) Proportions of modified H3.2-EGFP promoters enriched in indicated histone modifications. (F) Percentages of promoters enriched in indicated histone modification (x-axis) expressed as a percentage of all RefSeq promoters on the array (blue bars), as a percentage of H3.3 promoters (green bars), and as a percentage of H3.2 promoters (yellow bars). **p < 10−4 and *p < 0.05 relative to the percentage of RefSeq promoters; chi-square test with Yates' correction; ns, nonsignificant.
Figure 5.
Figure 5.
H3.3-EGFP promoters are enriched in methylated CpGs relative to all RefSeq promoters. (A) Two-dimensional scatter plot of MaxTen values for log2 IP/Input ratios for H3.3-EGFP versus DNA methylation. Average values for both MeDIP and ChIP replicates are shown. Data points were colored to indicate classification according to peak calling, to show promoters enriched in H3.3-EGFP (purple), methylated DNA (green), or in both (blue). Red bar shows the regression line for all data points. (B) Venn diagram analysis of DNA methylation, H3.3-EGFP enrichment, and H3K4me3 enrichment. (C) Proportions of DNA methylated promoters and H3.3 promoters relative to indicated reference (see legend). **p < 10−4 relative to the percentage of all RefSeq promoters; chi-square test with Yates' correction. (D) CpG content distribution among all H3.3-EGFP promoters and as reference among all human RefSeq promoters. **p < 0.001; ns, nonsignificant relative to proportions among all RefSeq promoters; chi-square test with Yates' correction.
Figure 6.
Figure 6.
H3.3-EGFP preferentially targets transcriptionally active promoters. (A) Percentage of expressed genes with a promoter occupied by indicated combinations of trimethylated (me3) H3K4, H3K9, and H3K27, with or without H3.3. *p < 0.05; **p < 0.001; ns, nonsignificant (Fisher's t test). Percentage of expressed genes among all RefSeq genes included in both Nimblegen and Illumina arrays also is shown (right). (B) Venn diagram analysis of H3.3, DNA methylated, and expressed genes. (C) Venn diagram analysis of H3.3, DNA methylated, and nonexpressed genes. (D) Percentage of H3.3 target HCPs, ICPs, and LCPs as a function of gene expression. **p < 0.001; ns, not significant; chi-square test with Yates' correction.
Figure 7.
Figure 7.
H3.3-EGFP targets genes are enriched in signaling and developmental functions involved in mesodermal differentiation. (A) Summary of GO term analysis of genes with promoters enriched in indicated H3 modifications or H3.3-only (see Supplemental Figure S5). (B) Top 12 most significant GO terms enriched among all H3.3-EGFP target genes and among expressed (present and marginal calls on Illumina arrays) and nonexpressed (absent calls) genes.

References

    1. Ahmad K., Henikoff S. The histone variant H3.3 marks active chromatin by replication-independent nucleosome assembly. Mol. Cell. 2002;9:1191–1200. - PubMed
    1. Barski A., Cuddapah S., Cui K., Roh T. Y., Schones D. E., Wang Z., Wei G., Chepelev I., Zhao K. High-resolution profiling of histone methylations in the human genome. Cell. 2007;129:823–837. - PubMed
    1. Bernstein B. E., et al. A bivalent chromatin structure marks key developmental genes in embryonic stem cells. Cell. 2006;125:315–326. - PubMed
    1. Black B. E., Foltz D. R., Chakravarthy S., Luger K., Woods V. L., Jr, Cleveland D. W. Structural determinants for generating centromeric chromatin. Nature. 2004;430:578–582. - PubMed
    1. Bolte S., Cordelieres F. P. A guided tour into subcellular colocalization analysis in light microscopy. J. Microsc. 2006;224:213–232. - PubMed

Publication types