

Mad3 negatively regulates B cell differentiation in the spleen by inducing Id2 expression
- PMID: 20375148
- PMCID: PMC2877644
- DOI: 10.1091/mbc.e09-09-0813
Mad3 negatively regulates B cell differentiation in the spleen by inducing Id2 expression
Abstract
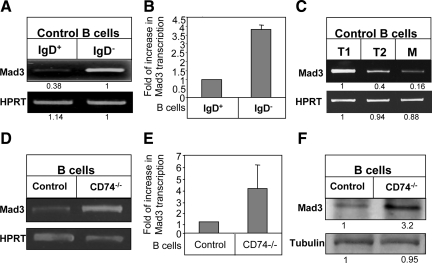
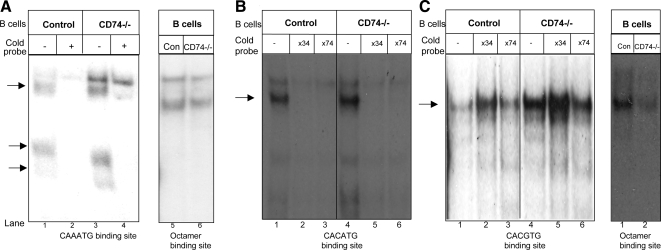
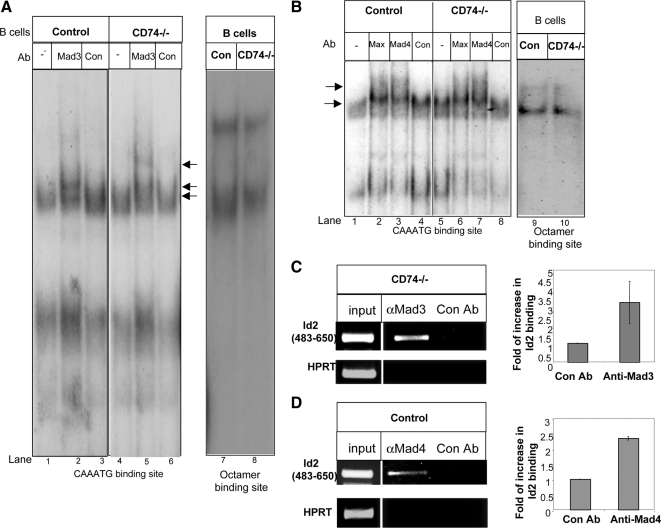
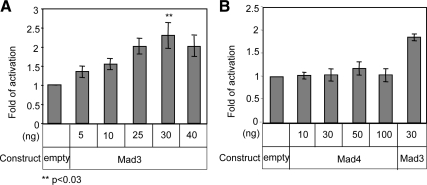
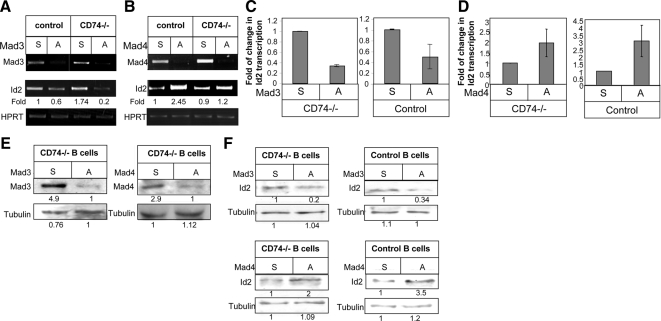
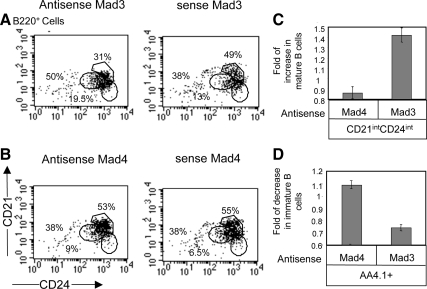
Immature B cells migrate to the spleen where they differentiate into mature cells. This final maturation step is crucial to enable B cells to become responsive to antigens and to participate in the immune response. Previously, we showed that Id2 acts as a negative regulator of the differentiation of immature B cells occurring in the spleen. Id2 expression has been found to depend on Myc-Max-Mad transcriptional complexes in mammary epithelial cells. Nearly all studies to date have shown that Mad proteins inhibit proliferation, presumably by antagonizing the function of Myc proteins. In the current study, we followed the Mad family members during peripheral B cell differentiation. We show that Mad3 actively regulates B cell differentiation. Our results demonstrate that high expression levels of Mad3 in immature B cells induce Id2 expression, which inhibits transcription of genes essential for B cell differentiation. During their differentiation to mature cells, B cells reduce their Mad3 expression, enabling the maturation process to occur.
Figures

Similar articles
-
Id2 negatively regulates B cell differentiation in the spleen.J Immunol. 2002 Jun 1;168(11):5507-13. doi: 10.4049/jimmunol.168.11.5507. J Immunol. 2002. PMID: 12023345
-
Invariant chain induces B cell maturation in a process that is independent of its chaperonic activity.Proc Natl Acad Sci U S A. 2002 Mar 5;99(5):3018-23. doi: 10.1073/pnas.052703299. Epub 2002 Feb 26. Proc Natl Acad Sci U S A. 2002. PMID: 11867743 Free PMC article.
-
Invariant chain-induced B cell differentiation requires intramembrane proteolytic release of the cytosolic domain.Immunity. 2002 Nov;17(5):549-60. doi: 10.1016/s1074-7613(02)00455-7. Immunity. 2002. PMID: 12433362
-
The role of inhibitor of binding or differentiation 2 in the development and differentiation of immune cells.Immunobiology. 2019 Jan;224(1):142-146. doi: 10.1016/j.imbio.2018.09.006. Epub 2018 Sep 20. Immunobiology. 2019. PMID: 30340915 Review.
-
Role of Id proteins in B lymphocyte activation: new insights from knockout mouse studies.J Mol Med (Berl). 2004 Sep;82(9):592-9. doi: 10.1007/s00109-004-0562-z. Epub 2004 Jun 4. J Mol Med (Berl). 2004. PMID: 15184986 Review.
Cited by
-
Loss of MXD3 induces apoptosis of Reh human precursor B acute lymphoblastic leukemia cells.Blood Cells Mol Dis. 2015 Apr;54(4):329-35. doi: 10.1016/j.bcmd.2014.12.002. Epub 2014 Dec 20. Blood Cells Mol Dis. 2015. PMID: 25554682 Free PMC article.
-
Downregulation of Max dimerization protein 3 is involved in decreased visceral adipose tissue by inhibiting adipocyte differentiation in zebrafish and mice.Int J Obes (Lond). 2014 Aug;38(8):1053-60. doi: 10.1038/ijo.2013.217. Epub 2013 Nov 20. Int J Obes (Lond). 2014. PMID: 24254064
-
Role of MXD3 in proliferation of DAOY human medulloblastoma cells.PLoS One. 2012;7(7):e38508. doi: 10.1371/journal.pone.0038508. Epub 2012 Jul 10. PLoS One. 2012. PMID: 22808009 Free PMC article.
-
MXD3 as an onco-immunological biomarker encompassing the tumor microenvironment, disease staging, prognoses, and therapeutic responses in multiple cancer types.Comput Struct Biotechnol J. 2021 Sep 2;19:4970-4983. doi: 10.1016/j.csbj.2021.08.047. eCollection 2021. Comput Struct Biotechnol J. 2021. PMID: 34584637 Free PMC article.
-
MXD3 regulation of DAOY cell proliferation dictated by time course of activation.BMC Cell Biol. 2014 Jul 23;15:30. doi: 10.1186/1471-2121-15-30. BMC Cell Biol. 2014. PMID: 25053245 Free PMC article.
References
-
- Allman D., Lindsley R. C., DeMuth W., Rudd K., Shinton S. A., Hardy R. R. Resolution of three nonproliferative immature splenic B cell subsets reveals multiple selection points during peripheral B cell maturation. J. Immunol. 2001;167:6834–6840. - PubMed
-
- Ayer D. E., Kretzner L., Eisenman R. N. Mad—a heterodimeric partner for Max that antagonizes myc transcriptional activity. Cell. 1993;72:211–222. - PubMed
-
- Ayer D. E., Lawrence Q. A., Eisenman R. N. Mad-Max transcriptional repression is mediated by ternary complex-formation with mammalian homologs of yeast repressor Sin3. Cell. 1995;80:767–776. - PubMed
-
- Becker-Herman S., Lantner F., Shachar I. Id2 negatively regulates B cell differentiation in the spleen. J. Immunol. 2002;168:5507–5513. - PubMed
-
- Foley K. P., Eisenman R. N. Two MAD tails: what the recent knockouts of Madl and Mxil tell us about the MYC/MAX/MAD network. Biochim. Biophys. Acta Rev. Cancer. 1999;1423:M37–M47. - PubMed
Publication types
MeSH terms
Substances
LinkOut - more resources
Full Text Sources
