. 2010 Jun;84(12):5923-35.
doi: 10.1128/JVI.02446-09. Epub 2010 Apr 7.

Regulation of de novo-initiated RNA synthesis in hepatitis C virus RNA-dependent RNA polymerase by intermolecular interactions

Affiliations

Regulation of de novo-initiated RNA synthesis in hepatitis C virus RNA-dependent RNA polymerase by intermolecular interactions

S Chinnaswamy et al. J Virol. 2010 Jun.

Abstract

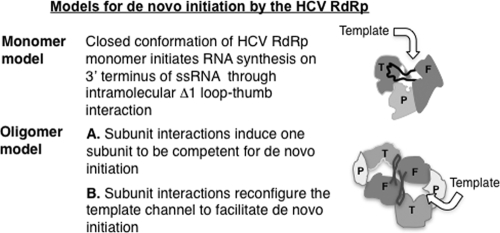
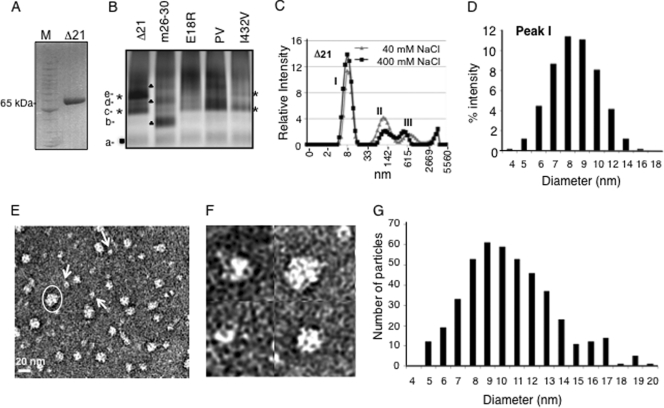
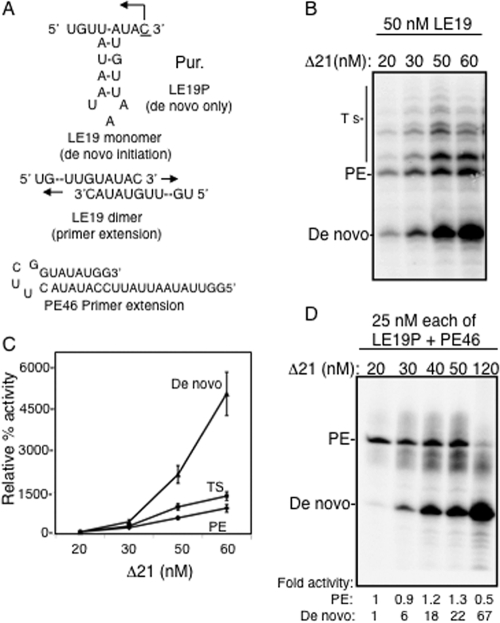
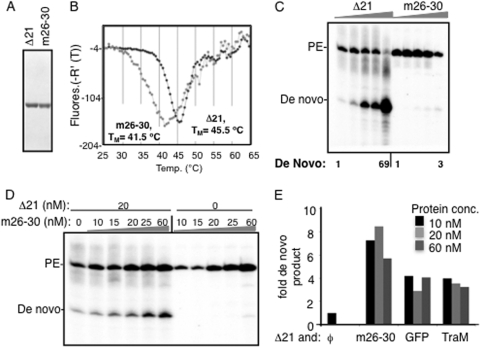
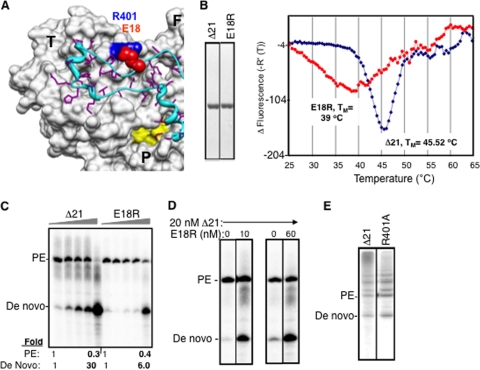
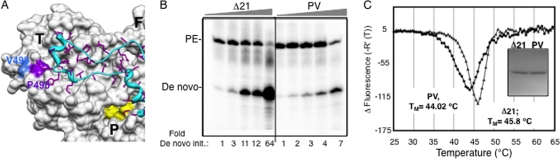
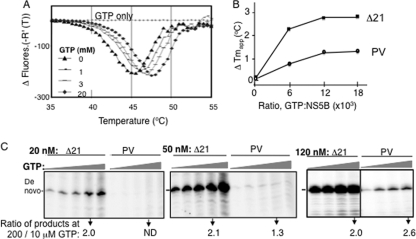
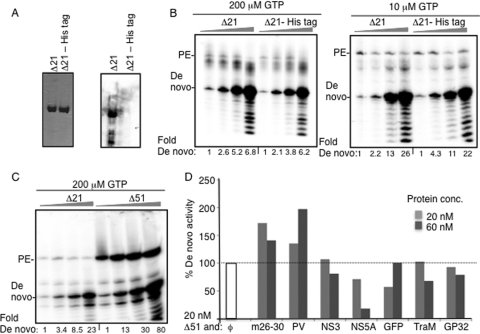
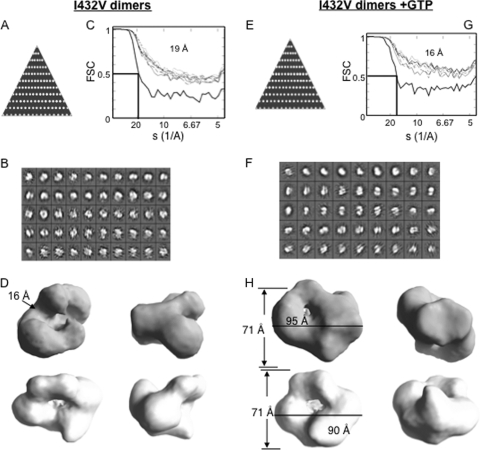
The hepatitis C virus (HCV) RNA-dependent RNA polymerase (RdRp) has been proposed to change conformations in association with RNA synthesis and to interact with cellular proteins. In vitro, the RdRp can initiate de novo from the ends of single-stranded RNA or extend a primed RNA template. The interactions between the Delta1 loop and thumb domain in NS5B are required for de novo initiation, although it is unclear whether these interactions are within an NS5B monomer or are part of a higher-order NS5B oligomeric complex. This work seeks to address how polymerase conformation and/or oligomerization affects de novo initiation. We have shown that an increasing enzyme concentration increases de novo initiation by the genotype 1b and 2a RdRps while primer extension reactions are not affected or inhibited under similar conditions. Initiation-defective mutants of the HCV polymerase can increase de novo initiation by the wild-type (WT) polymerase. GTP was also found to stimulate de novo initiation. Our results support a model in which the de novo initiation-competent conformation of the RdRp is stimulated by oligomeric contacts between individual subunits. Using electron microscopy and single-molecule reconstruction, we attempted to visualize the low-resolution conformations of a dimer of a de novo initiation-competent HCV RdRp.


Figures

FIG. 1.
FIG. 1.
Models for RNA synthesis by the HCV RdRp. The monomer model is based on the central tenet that intramolecular interactions within an RdRp molecule regulate the modes of RNA synthesis. The curved arrow represents the possible orientation of the template RNA. The oligomer model is an adaptation from the dimer model of the norovirus RdRp (18). T, P, and F represent the thumb, palm, and finger domains, respectively, in different shades of gray, and the thick black line connecting the thumb and finger domains represents the Δ1 loop.
FIG. 2.
FIG. 2.
Analysis of the conformations and oligomeric states of the HCV RdRp. (A) SDS-PAGE demonstrating the mobility of the Δ21 protein at ∼65 kDa under denaturing conditions. The molecular mass markers are from Invitrogen (Benchmark protein ladder). (B) Blue-native gel of Δ21 and its variants that are affected for RNA synthesis. The different bands that were distinct in mobility and intensity are labeled from a to e. Bands that were common to all proteins are indicated by a filled box; bands common to the Δ21 and I432V proteins are shown with asterisks; bands in m26-30 are shown with filled triangles. (C) DLS analysis of Δ21 at 40 mM and 400 mM NaCl. (D) Polydisperse nature of the peak I from panel C. (E) A representative EM image of 5 ng/μl Δ21 in a Tris buffer containing 100 mM NaCl. The particles were stained with uranyl acetate after adsorption onto carbon grids. The scale bar is shown at bottom left. The arrows point to the likely monomers based on the estimated sizes of the particles. Note that some monomeric particles may represent different orientations attached to the grid, hence appearing in different shapes. One of the oligomers is indicated with an oval. (F) Magnified view of micrographs showing putative Δ21 monomers and oligomers. (G) A histogram of the dimensions of 440 particles of Δ21 picked from different micrographs. The measurements were made manually using the image processing software ImageJ (NCBI) at a 2.35-Å/pixel ratio at the specimen level. Two measurements were taken each at the longest and widest dimensions of each particle at roughly perpendicular angles, and the averages of the two measurements are plotted as histograms.
FIG. 3.
FIG. 3.
Higher enzyme concentrations selectively stimulated de novo initiation by Δ21. (A) The templates used in the analysis. Template LE19 exists as a monomer and directs the synthesis of a 19-nucleotide (nt) de novo initiation product from Δ21, while it can also form a dimer with another LE19 molecule and directs the synthesis of a primer extension product of 32 nt. The capital P represents a puromycin covalently attached to the 3′ terminus of the RNA LE19P. PE46 is a stem-loop structure that can direct a primer extension product of 46 nt. (B) A representative gel image of the RdRp assay described using different concentrations of Δ21 with a constant concentration of 50 nM LE19 and 0.1 mM ATP, UTP, 0.01 mM GTP, and 33 nM (α-32P)CTP. PE and Ts denote primer extension and template switch, respectively. (C) Quantification of products of RdRp reaction. The 19-nt product is quantified as a de novo initiation product, the 32-nt product as a primer extension (PE) product, and all other higher-molecular-weight products as template switch (indicated as Ts in the left of the image). The error bars represent standard deviations from three reactions. The respective activities at 20 nM were normalized to 100%, and the relative increase at different concentrations is plotted. (D) A gel image of the products of the RdRp assay carried out as in panel B but with the templates LE19P and PE46. PE, primer extension. Each of the RNAs was at a concentration of 25 nM. The de novo and primer extension activitiess at different enzyme concentrations were normalized and compared to that of a 20 nM enzyme concentration and are indicated below respective lanes.
FIG. 4.
FIG. 4.
Intermolecular interactions in the RdRp can stimulate de novo initiation. (A) Image of SDS-PAGE of the Δ21 and m26-30 proteins used in these studies. m26-30 has a five-amino-acid deletion at the tip of the Δ1 loop (10). (B) DSF analysis of 2 μM Δ21 or m26-30. The fluorescence increase due to binding of SYPRO orange dye to hydrophobic patches in the protein is plotted as a negative derivative on the y axis. The plots were generated from the software package MxPro supplied with the real-time PCR machine (Stratagene). The minimal point on the y axis for each plot is considered the Tmapp. (C) Products of RNA synthesis assays as shown by Δ21 and m26-30 using an equal mix of the LE19P and PE46 templates. The primer extension (PE) and de novo-initiated products are marked to the left of the gel image. (D) Effects of m26-30 on de novo initiation by 20 nM Δ21. This concentration of Δ21 was selected since de novo initiation products are at a low level. The addition of m26-30, which is debilitated for de novo initiation but could retain protein-protein interaction, was able to stimulate de novo initiation by Δ21. (E) Quantification of the increase in de novo initiation by 20 nM Δ21 in the presence of m26-30 or two unrelated proteins. Δ21 and the second protein were mixed and incubated on ice for 30 min before the RNA synthesis reaction was initiated as described in Materials and Methods. The unrelated proteins were added to test for the effects of molecular crowding.
FIG. 5.
FIG. 5.
The E18R mutant can stimulate de novo initiation by Δ21. (A) A surface and ribbon representation of the X-ray crystal structure of HCV RdRp (PDB identifier 1QUV) to highlight the location of E18 (red spheres) and its interaction with R401 (blue spheres). The complete thumb domain (T), a part of the palm (P) domain, and a part of the finger (F) domain are marked. The active site metal coordinating residues in the active site are in yellow. The Δ1 loop that connects the fingers and thumb domain is in ribbon representation and is colored cyan, while the side chains of its residues are in purple. (B) SDS-PAGE of proteins used in the reactions and their behavior in a DSF reaction. (C) Representative image of the products of the RdRp assay with templates LE19P and PE46 with increasing concentrations of the Δ21 or E18R protein. The ratio of increase in the de novo-initiated product has been quantified below the gel image. (D) Effects of amending an RNA synthesis where Δ21 was kept constant at 20 nM while the E18R protein was at 10 or 60 nM. The two enzymes were preincubated on ice for 30 min before the RNAs were added. (E) R401A mutation does not affect wild-type activity of NS5B. The template LE19 was used in this assay, and the gel image of a representative reaction is shown, indicating the 19-nt de novo product and the 32-nt primer extension product.
FIG. 6.
FIG. 6.
The allosteric GTP binding site and de novo initiation of RNA synthesis. (A) The location of the low-affinity GTP binding site on the surface of the thumb domain of HCV RdRp (PDB identifier 1QUV) as shown by Bressanelli et al. (6). T, F, and P, thumb, finger, and palm domains, respectively. The Δ1 loop is in cyan, and the residues P495 and V499, which were shown to bind GTP on the thumb domain, are shown in different colors. The side chains of S29 and R32, which are located in the Δ1 loop, are not highlighted, while the surfaces of P495 and V499 are in purple and blue, respectively, as indicated. Residue R503, which is part of the putative allosteric pocket, is also not highlighted. (B) Gel image of the RdRp reaction products using LE19P and PE46 with increasing protein concentrations. The two proteins were at 20, 30, 40, 50, and 120 nM in the assays. The amounts of de novo-initiated product at different enzyme concentrations were normalized and compared to that of a 20 nM concentration of either the PV mutant or Δ21, as indicated below respective lanes. PE, primer extension. (C) DSF analysis of Δ21 and PV mutant as for Fig. 4D to examine conformational differences between the two proteins. The inset shows SDS-PAGE of the two proteins used.
FIG. 7.
FIG. 7.
GTP can stabilize Δ21 conformation and increase de novo initiation. (A) Tmapp of a 2 μM concentration of Δ21 in the absence or presence of increasing concentrations of GTP. The Tmapp was 45.5, 46.05, 47.02, and 47.52°C at 0, 1, 3, and 20 mM GTP, respectively. (B) Increase in Tmapp of PV mutant in comparison to Δ21 at increasing GTP concentrations as indicated in the x axis. The derivative of the Tmapp at different GTP concentrations is plotted. (C) Gel image of the products of RNA synthesis by Δ21 and the PV mutant at three enzyme concentrations along with increasing GTP concentrations. LE19P was the template, and GTP was included at 0.01, 0.05, 0.1, 0.2, and 0.5 mM, while ATP and UTP were at 0.1 mM along with 33 nM (α-32P)CTP. A gel image of the products of the RdRp assay of Δ21 and the PV mutant at a 120 nM concentration with increasing GTP concentrations (0.01, 0.05, 0.1, and 0.2 mM GTP, as represented by the gray triangles), is shown. The fold increases in de novo initiation activity for different concentrations of Δ21 and the PV mutant when GTP was increased from 0.01 mM to 0.2 mM are shown at the bottom of the gel image.
FIG. 8.
FIG. 8.
The C-terminal His tag in Δ21 does not affect de novo initiation. (A) SDS-PAGE showing the Δ21 protein with and without the His tag used in RNA synthesis assays. The gel image on the left was stained with Coomassie blue, and the one to the right was a comparable set of proteins transferred onto a nitrocellulose membrane probed in a Western blot with monoclonal antibody (MAb) specific for the histidine tag (Santa Cruz Biotechnology). (B) Representative gel images of an RdRp reaction with 20, 40, 60, and 120 nM (shown by the flattened triangle) of Δ21 or the Δ21-His tag protein (Δ21 minus the 6-His tag) at two GTP concentrations. The products (19 nt) were quantified, the intensity at 20 nM was set as 1, and the relative increase in intensities in shown below each lane. (C) Representative gel images of an RdRp reaction with 20, 40, 60, and 120 nM (shown by the flattened triangle) of the Δ21 and Δ51 enzymes. (D) Quantification of the effect of a second protein on the amount of de novo initiation products made by 20 nM Δ51. Δ51 was incubated with the respective amounts of each protein on ice for 30 min before the mix was added in RdRp assays as described in Materials and Methods. The amount of de novo-initiated 19-nt product made in the absence of a second protein (white bar) was normalized to 100%. The amounts of the 19-nt product produced in the presence of a 20 or 60 nM concentration of the other proteins are shown as gray bars.
FIG. 9.
FIG. 9.
Selection of I432V for reconstruction of dimeric RdRp molecules. (A) The location of I432 in the thumb domain of NS5B. I432 is colored black, and the Δ1 loop is shown as a ribbon structure. The thumb and palm domains are labeled T and P, respectively. (B) Effects of increasing concentrations of the I432V, Δ21, and E18R proteins on the production of de novo initiation products. The assays were performed with LE19P and PE46 as described in the legend to Fig. 3D. The amount of the 19-nt de novo-initiated product was normalized to that at 20 nM for each of the three enzymes. The I432V protein produced more de novo initiation products than the other two enzymes at 120 nM compared to results at 20 nM enzyme. (C) The elution profiles of the Δ21 and I432V proteins from Superdex-200 columns. About 100 μg of each protein in the presence or absence of 20 mM GTP was injected into the column before gel filtration was performed. The calibration showed that a 44-kDa chicken ovalbumin protein elutes at the 15.1-ml position. The fractions collected were subjected to SDS-PAGE and then stained with Coomassie blue for visualization. The asterisk denotes peak fractions that contain complexes which are more heterogeneous in the Δ21 sample than in the I432V sample. (D) The effects of GTP on the Tmapp of the Δ21 and I432V proteins. The ratios of the GTP to protein are plotted against the change in Tmapp. (E) The distribution of dimensions for Δ21 with and without GTP. Δ21 (20 nM) without or with 2 mM GTP was spread on carbon-coated grids and then stained with uranyl acetate. The samples were imaged and sorted into class averages as described in Materials and Methods. The lengths of the longest (dimension 1) and shortest (dimension 2) dimensions for each of the subclasses are plotted, as well as the number of particles in each subclass. (F) The distribution of dimensions for the I432V mutant with and without GTP.
FIG. 10.
FIG. 10.
Single-particle analysis and reconstruction of I432V dimers in the presence or absence of GTP. (A) Asymmetry triangle showing distribution of orientation of the particles that constitute the model for I432V dimers. (B) Class averages as generated for the I432V dimer complex with no presumed symmetry using the EMAN program's refine2d command. (C) Fourier shell correlation (FSC) showing the convergence of the final model for the I432V protein to 19 Å as per the 0.5 σ criterion. (D) Different orientations of the final model for I432V dimers. The model measures 71 Å by 95 Å with a groove of about 16 Å. (E) Asymmetry triangle that shows the particle orientation for the final model of I432V dimers in the presence of GTP. (F) Class averages for I432V dimers complexed with GTP with no presumed symmetry (see Materials and Methods). (G) Fourier shell correlation for I432V dimers with GTP showing that the model has converged to a 16-Å resolution. (H) Different views of the final model for I432V dimers plus GTP complex. The model has dimensions of 71 Å by 90 Å.

Similar articles

Cited by

References

    1. Ahlquist, P., S. X. Wu, P. Kaesberg, C. C. Kao, R. Quadt, W. DeJong, and R. Hershberger. 1994. Protein-protein interactions and glycerophospholipids in bromovirus and nodavirus RNA replication. Arch. Virol. Suppl. 9:135-145. - PubMed
    1. Binder, M., D. Quinkert, O. Bochkarova, R. Klein, N. Kezmic, R. Barthenschlager, and V. Lohmann. 2007. Identification of determinants involved in initiation of hepatitis C virus RNA synthesis by using intergenotypic replicase chimeras. J. Virol. 81:5270-5283. - PMC - PubMed
    1. Biswal, B. K., M. M. Cherney, M. Wang, L. Chan, C. G. Yannopoulos, D. Bilimoria, O. Nicolas, J. Bedard, and M. N. James. 2005. Crystal structures of the RNA-dependent RNA polymerase genotype 2a of hepatitis C virus reveal two conformations and suggest mechanisms of inhibition by non-nucleoside inhibitors. J. Biol. Chem. 280:18202-18210. - PubMed
    1. Blumenthal, T., and G. G. Carmichael. 1979. RNA replication: function and structure of Qbeta-replicase. Annu. Rev. Biochem. 48:525-548. - PubMed
    1. Bressanelli, S., L. Tomei, A. Roussel, I. Incitti, R. L. Vitale, M. Mathieu, R. De Francesco, and F. A. Rey. 1999. Crystal structure of the RNA-dependent RNA polymerase of hepatitis C virus. Proc. Natl. Acad. Sci. U. S. A. 96:13034-13039. - PMC - PubMed

Publication types

MeSH terms