. 2010 Jun;84(12):6254-61.
doi: 10.1128/JVI.00419-10. Epub 2010 Apr 7.

Enhancerless cytomegalovirus is capable of establishing a low-level maintenance infection in severely immunodeficient host tissues but fails in exponential growth

Affiliations

Enhancerless cytomegalovirus is capable of establishing a low-level maintenance infection in severely immunodeficient host tissues but fails in exponential growth

Jürgen Podlech et al. J Virol. 2010 Jun.

Abstract

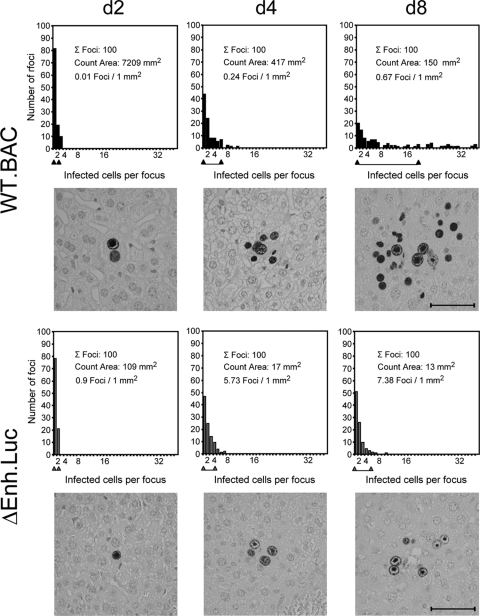
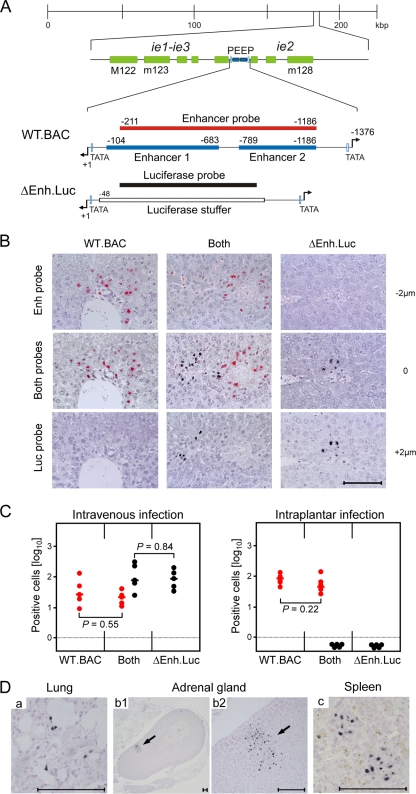
Major immediate-early transcriptional enhancers are genetic control elements that act, through docking with host transcription factors, as a decisive regulatory unit for efficient initiation of the productive virus cycle. Animal models are required for studying the function of enhancers paradigmatically in host organs. Here, we have sought to quantitatively assess the establishment, maintenance, and level of in vivo growth of enhancerless mutants of murine cytomegalovirus in comparison with those of an enhancer-bearing counterpart in models of the immunocompromised or immunologically immature host. Evidence is presented showing that enhancerless viruses are capable of forming restricted foci of infection but fail to grow exponentially.


Figures

FIG. 1.
FIG. 1.
MIE enhancer function in cultured fibroblasts. (A) Enhancement of viral transcription. BALB/c MEFs were infected under conditions of centrifugal enhancement of infectivity with 0.2 PFU per cell of mCMV-WT.BAC (black circles) or mCMV-ΔEnh.Luc (gray circles), resulting in an effective MOI of 4 (25, 32). Total RNA was isolated at the indicated times after the end of the 30-min centrifugation period. Absolute quantitation of IE1, IE3, and E1 transcripts was performed by reverse transcriptase quantitative PCR (RT-qPCR) as described in detail previously (39), and data were normalized to 10 ng of total RNA corresponding to ∼1,000 cells. Symbols represent data from individual, triplicate six-well cultures. (B) Time course of viral protein expression. Western blot analysis was performed after infection of MEFs at an MOI of 4 (see above) essentially as described previously (18). n.i. (not infected), lysates from uninfected MEFs. Proteins IE1/m123 (23) and E1/M112-M113 (5, 10) were detected with monoclonal antibodies (MAbs) CROMA 101 and CROMA 103, respectively (kindly provided by S. Jonjic, Rijeka, Croatia). IE3/M122 (30) was detected with a polyclonal rabbit antiserum (kindly provided by M. Messerle, Hannover, Germany), and MCP/M86 with affinity-purified polyclonal rabbit antibodies, custom-made as described previously (46). ACTB, β-actin detected with affinity-purified polyclonal rabbit antibody. (C) Expression and function of IE1 in individual cells. CLSM analysis was performed essentially as described and documented previously (39, 46) for correlating ND10 numbers and levels of IE1 expression in the nuclei of the indicated numbers (n) of individual MEFs at 4 h after infection at an MOI of 4 with mCMV-ΔIE1 (ΔIE1, black diamonds), mCMV-ΔEnh.Luc (ΔEnh.Luc, dark-green diamonds), and mCMV-WT.BAC (WT.BAC, bright-green diamonds). Horizontal and vertical dotted lines mark the median values of ND10 numbers (ordinate) and relative IE1 fluorescein (FITC) fluorescence intensities (abscissa), respectively. The indicated P values for differences in ND10 numbers were calculated with the nonparametric and distribution-free Kolmogorov-Smirnov test. Data sets differ significantly if the P value is <0.05. (D) Imaging of multistep virus growth in fibroblast cell cultures documenting focal spread of infection. BALB/c MEFs grown on glass coverslips in 24-well plates were infected noncentrifugally at an MOI of 0.05 with mCMV-WT.BAC (top panels) and mCMV-ΔEnh (bottom panels). FITC fluorescence images were taken after IE1 (CROMA 101) staining at the indicated times after infection. The bar marker represents 200 μm.
FIG. 2.
FIG. 2.
Virus multiplication in host organs. Throughout, symbols indicate three to four individual mice tested for each day and group, with the median values marked by a short horizontal bar. (A and B) Virus multiplication in the liver of the severely immunocompromised host. Female BALB/c mice (8 weeks old) underwent hematoablative treatment by total-body gamma irradiation with a single dose of 7 Gy, 2 h prior to intravenous infection with mCMV-WT.BAC (black circles) or mCMV-ΔEnh.Luc (gray circles). (A) Virus dose dependence and kinetics of infection. Liver tissue infection was assessed by quantitating infected liver cells, mostly hepatocytes, in representative 10-mm2 areas of tissue sections by IHC specific for the intranuclear proteins IE1/m123 (for the method, see references and 32) and MCP/M86 (for the method, see reference 46), representing the IE and L phases of the viral replicative cycle. To compensate for reduced IE1 expression after infection with mCMV-ΔEnh.Luc, the period of color reaction was extended from the usual 2 min (sufficient for mCMV-WT.BAC) to 10 min. *, all mice succumbed to infection with 104 PFU of mCMV-WT.BAC. (B) Multiplication of viral genomes in the liver. Viral genome numbers in the liver were quantitated at the indicated days after infection with 103 PFU of mCMV-WT.BAC (black circles) or 106 PFU of mCMV-ΔEnh.Luc (gray circles) by qPCR specific for gene M55/gB as described previously (38), using linearized plasmid pDrive_gB_PTHrP_Tdy as the standard (41). Log-linear growth curves were determined by regression analysis, and doubling times (DT) as well as their 95% confidence intervals (shown in parentheses) were calculated as explained in greater detail elsewhere (46). (C) Virus multiplication in the immunologically immature neonatal host. Three-day-old BALB/c pups were infected intraperitoneally with 5 × 10² PFU of mCMV-WT.BAC (black circles) or 2 × 10⁶ PFU of mCMV-ΔEnh (gray circles). At days 4 and 7 after infection, virus titers in homogenates of the indicated organs were determined by PFU assay with centrifugal enhancement of infectivity, performed on monolayers of MIE-complementing NIH 3T3-Bam cells (16). Dotted lines indicate the detection limit of the assay. Note that infection of pups with 5 × 10⁴ PFU of mCMV-ΔEnh did not yield detectable virus in any of the organs tested (data not depicted).
FIG. 3.
FIG. 3.
Focal spread of infection in liver tissue. Immunocompromised mice (see legend of Fig. 2) were infected intravenously with 103 PFU of mCMV-WT.BAC (black bars) or 107 PFU of mCMV-ΔEnh.Luc (gray bars). IHC specific for IE1/m123 (MAb CROMA 101) was performed in liver tissue sections at the indicated days after infection by using the peroxidase-diaminobenzidine-nickel method for black staining (15, 32), followed by light hematoxylin counterstaining. Data were collected and pooled from three mice per day and group. Bar diagrams show the size distributions of 100 infectious foci counted. Caliper rules underneath the abscissas as well as representative IHC images highlight the increase in median focus size over time. Bar markers represent 50 μm.
FIG. 4.
FIG. 4.
In situ verification of virus authenticity. (A) Maps of the mCMV genome (not drawn to scale), illustrating the organization of the mCMV MIE locus with the regulatory promoter-enhancer-enhancer-promoter (PEEP) region and the exons of the flanking IE genes as well as the positions of the ISH DNA probes. Map positions refer to the 5′ transcription start site (+1) of the ie1-ie3 transcription unit, equivalent to nucleotide 182,895 in the mCMV Smith strain genome (33) (GenBank accession no. NC_004065). Arrows indicate the DNA strand and the divergent 5′-to-3′ directions of transcription for the bidirectional MIE gene pair. (B) Virus identification by two-color ISH in the coinfection model. Immunocompromised mice were infected with 103 PFU of mCMV-WT.BAC alone, with 107 PFU of mCMV-ΔEnh.Luc alone, or with a mixture of both viruses in the 103:107 PFU ratio. ISH images of serial 2-μm liver tissue sections were taken on day 10 after infection. Sections were hybridized in a chessboard scheme with the mCMV enhancer probe (Enh probe, red staining) alone identifying cells infected with mCMV-WT.BAC, with the luciferase gene stuffer probe (Luc probe, black staining) alone identifying cells infected with mCMV-ΔEnh.Luc, or with a mixture of both probes identifying both viruses simultaneously. Staining methods were described in detail previously (15, 32). Light counterstaining was performed with hematoxylin. The bar marker represents 100 μm. (C) Independent growth of the enhancerless mutant. A possible trans-complementation of mCMV-ΔEnh.Luc by mCMV-WT.BAC was tested by comparing single infection quantitatively with coinfection. Corresponding to the experiment shown in panel B, ISH-positive cells were counted for representative 10-mm2 areas of liver tissue sections. Red and black circles represent data from five mice per group, with the median values marked by a short horizontal bar. The dotted lines indicate the detection limit of the assay, that is, 1 cell in 10 mm2. Statistical comparisons of interest were made with the distribution-free Wilcoxon-Mann-Whitney (rank sum) test. P values (two-tailed) of >0.05 indicate that there is no significant difference. The left panel shows intravenous single infection or coinfection with 103 PFU of mCMV-WT.BAC (red) and 107 PFU of mCMV-ΔEnh.Luc (black). The right panel shows intraplantar single infection or coinfection with 105 PFU of either virus. (D) Organ tropism of mCMV-ΔEnh.Luc. Corresponding to the experiment shown in panel B (lower right ISH image), infected cells were identified with the Luc probe (black) in lung (a), adrenal gland (b1; whole organ overview section resolved to greater detail in b2; arrows point to a particularly extended viral focus), and spleen (c). Bar markers represent 100 μm throughout.

Similar articles

Cited by

References

    1. Angulo, A., P. Ghazal, and M. Messerle. 2000. The major immediate-early gene ie3 of mouse cytomegalovirus is essential for viral growth. J. Virol. 74:11129-11136. - PMC - PubMed
    1. Angulo, A., M. Messerle, U. H. Koszinowski, and P. Ghazal. 1998. Enhancer requirement for murine cytomegalovirus growth and genetic complementation by the human cytomegalovirus enhancer. J. Virol. 72:8502-8509. - PMC - PubMed
    1. Bain, M., M. Reeves, and J. Sinclair. 2006. Regulation of human cytomegalovirus gene expression by chromatin remodeling, p. 167-183. In M. J. Reddehase (ed.), Cytomegaloviruses: molecular biology and immunology. Caister Academic Press, Wymondham, Norfolk, United Kingdom.
    1. Blackwood, E. M., and J. T. Kadonaga. 1998. Going the distance: a current view of enhancer action. Science 281:60-63. - PubMed
    1. Bühler, B., G. M. Keil, F. Weiland, and U. H. Koszinowski. 1990. Characterization of the murine cytomegalovirus early transcription unit e1 that is induced by immediate-early proteins. J. Virol. 64:1907-1919. - PMC - PubMed

Publication types