. 2010 Jun;84(12):5909-22.
doi: 10.1128/JVI.01797-09. Epub 2010 Apr 7.

Through its nonstructural protein NS1, parvovirus H-1 induces apoptosis via accumulation of reactive oxygen species

Affiliations

Through its nonstructural protein NS1, parvovirus H-1 induces apoptosis via accumulation of reactive oxygen species

Georgi Hristov et al. J Virol. 2010 Jun.

Abstract

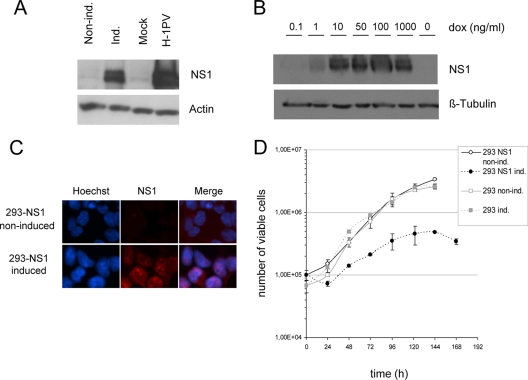
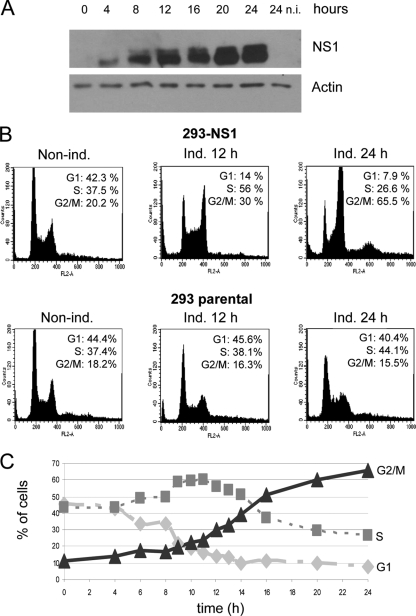
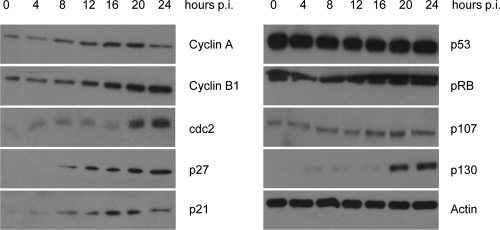
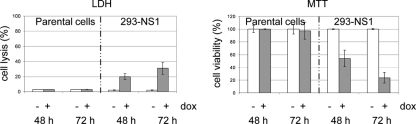
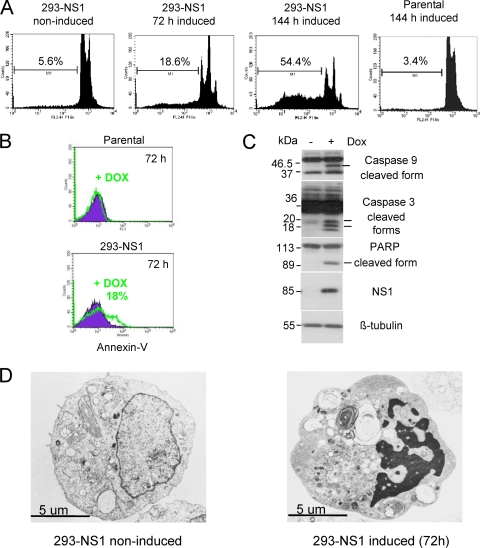
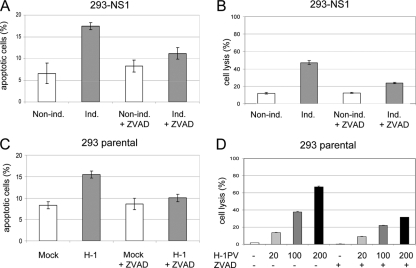
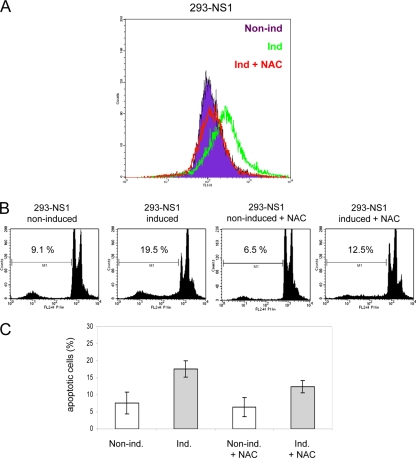
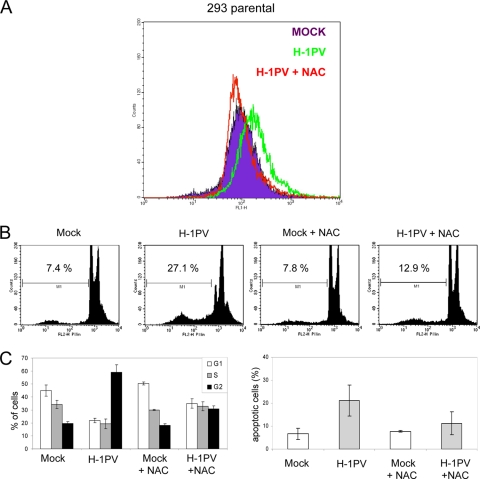
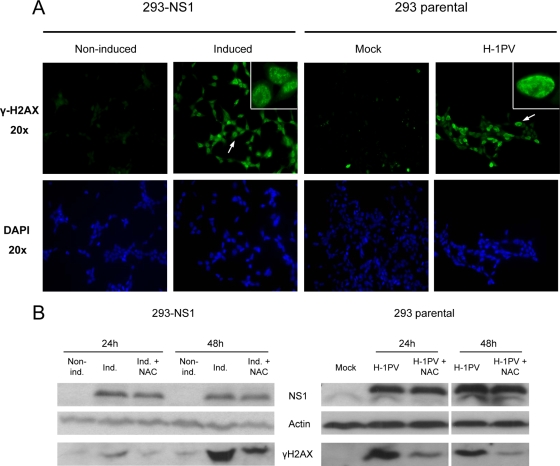
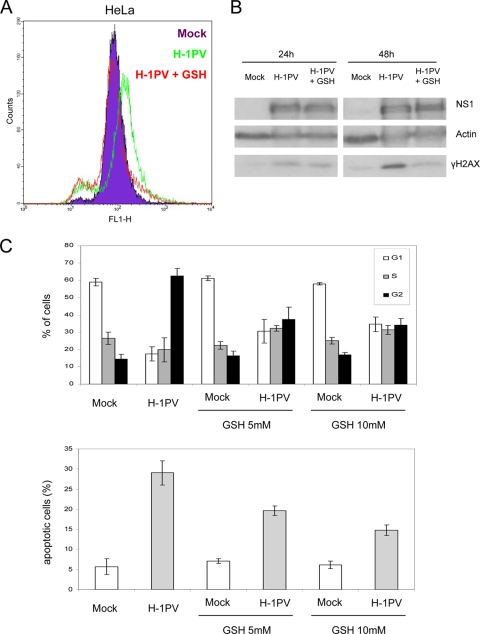
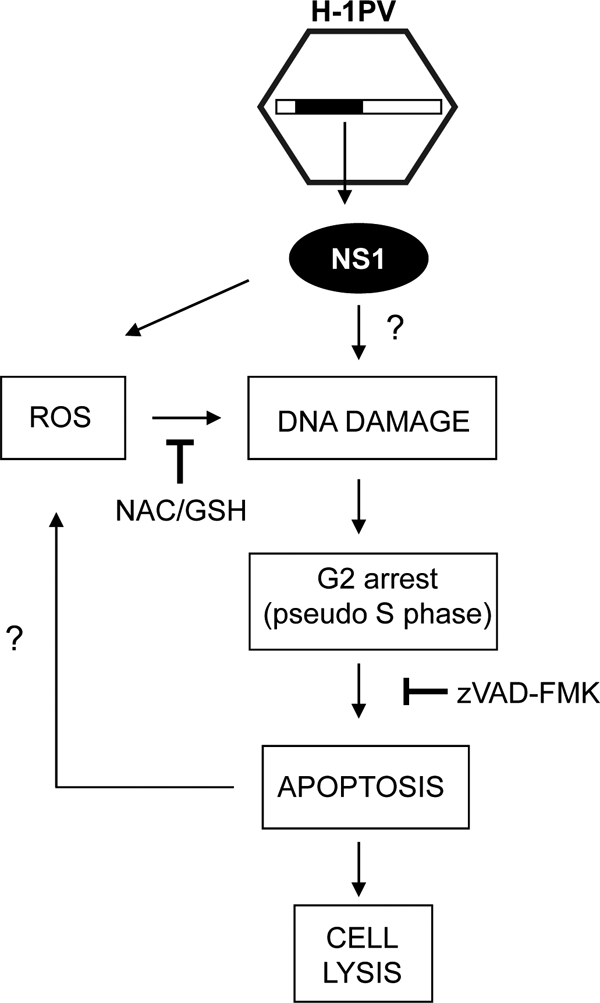
The rat parvovirus H-1 (H-1PV) attracts high attention as an anticancer agent, because it is not pathogenic for humans and has oncotropic and oncosuppressive properties. The viral nonstructural NS1 protein is thought to mediate H-1PV cytotoxicity, but its exact contribution to this process remains undefined. In this study, we analyzed the effects of the H-1PV NS1 protein on human cell proliferation and cell viability. We show that NS1 expression is sufficient to induce the accumulation of cells in G(2) phase, apoptosis via caspase 9 and 3 activation, and cell lysis. Similarly, cells infected with wild-type H-1PV arrest in G(2) phase and undergo apoptosis. Furthermore, we also show that both expression of NS1 and H-1PV infection lead to higher levels of intracellular reactive oxygen species (ROS), associated with DNA double-strand breaks. Antioxidant treatment reduces ROS levels and strongly decreases NS1- and virus-induced DNA damage, cell cycle arrest, and apoptosis, indicating that NS1-induced ROS are important mediators of H-1PV cytotoxicity.


Figures

FIG. 1.
FIG. 1.
The 293-NS1 system allows the tightly controlled induction of H-1PV NS1 expression. The human T-REx Flp-In HEK-293 embryonic kidney cell line expressing the full-length H-1PV NS1 gene under the control of a doxycycline-inducible promoter (293-NS1) was established as described in Materials and Methods. (A) Total protein extracts were prepared from cells treated (induced [ind.]) or not treated (noninduced [non ind.]) with doxycycline (1,000 ng/ml) for 24 h or from cells infected for 24 h with H-1PV (MOI, 20 PFU/cell). Equal amounts of proteins were separated by SDS-PAGE and analyzed for the presence of NS1 protein by Western blot analysis. Actin was used as a loading control. (B) Total protein extracts were prepared from cells either grown in the absence (far right lane) or presence of various doxycycline concentrations, indicated on top of the lanes, and tested for their NS1 content, as described in the legend to panel A. β-tubulin was used as a loading control. (C) Induced and noninduced 293-NS1 cells were grown on coverslips, fixed, and processed for immunofluorescence using anti-NS1 and Alexa Fluor 594 anti-mouse secondary antibodies (red) and Hoechst nuclear staining (blue). The merge picture shows the nuclear localization of NS1. (D) Parental 293 and stably transfected 293-NS1 cell lines were seeded at a low density and cultured in the presence (ind.) or absence (non ind.) of doxycycline (1,000 ng/ml). Cell numbers were measured every 24 h. Mean values resulting from three independent experiments, each performed in triplicate, are given, with standard deviation bars shown.
FIG. 2.
FIG. 2.
NS1 arrests the cell cycle at the G2/M stage. Parental and stably transfected 293-NS1 cells were cultured in medium supplemented (ind.) or not supplemented (non ind.) with doxycycline for 12 or 24 h and processed for Western blot analysis and FACS determination of cell cycle distribution. (A) Western blot analysis for the steady-state levels of NS1 protein. n.i., noninduced. (B) FACS analysis. At least 20,000 events were acquired for each flow cytometric analysis. The percentage of cells in the G1, S, and G2/M phases of the cell cycle was calculated by using the ModFit software. (C) NS1-induced cells were collected at the times indicated and analyzed by flow cytometry, as indicated in the legend to panel A.
FIG. 3.
FIG. 3.
NS1 expression is associated with differential expression of cell cycle regulatory proteins. Doxycycline was added to the medium (1,000 ng/ml) of 293-NS1 cultures. Whole cellular lysates were prepared every 4 h and subjected to SDS-PAGE fractionation and immunoblotting using the antibodies indicated. Actin was used as a loading control. p.i., postinfection.
FIG. 4.
FIG. 4.
NS1 expression is sufficient to induce cell lysis. Cell lysis and viability were measured by LDH and MTT assays, respectively, in parental 293 and 293-NS1 cultures grown in the absence (−) or presence (+) of doxycycline (1,000 ng/ml) for 48 and 72 h. Average values with standard deviation bars are shown from three independent experiments performed in triplicate.
FIG. 5.
FIG. 5.
NS1 induces apoptosis in HEK-293 cells. (A) Cells grown in the presence (induced) or absence (noninduced) of doxycycline were harvested at the indicated times, fixed, labeled with propidium iodide, and analyzed by FACS. At least 15,000 events were analyzed for the presence of DNA fragmentation (sub-G1 DNA content) and subsequently evaluated using the CellQuest software. Values represent the percentages of cells with less than 2N DNA content (sub-G1 cell population). (B) Parental and 293-NS1 cells were grown in medium supplemented or not supplemented with doxycycline. After 72 h, cells were stained with annexin V Fluos/To-Pro-3 and subjected to flow cytometric analysis. Results from a representative experiment are shown. (C) Total protein extracts were prepared from 293-NS1 cells induced (+) and not induced (−) with doxycycline for 72 h and then subjected to SDS-PAGE and analyzed by immunoblotting using antibodies specific for caspase 9, caspase 3, PARP, NS1, and β-tubulin (used as a loading control). Bars indicate active caspases and PARP cleavage products. (D) Electron microscopy picture of an NS1-expressing cell (293-NS1 induced), showing typical features of apoptosis (chromatin condensation and nuclear fragmentation), compared with a control cell (293-NS1 noninduced).
FIG. 6.
FIG. 6.
The pan-caspase inhibitor zVAD-FMK protects NS1-expressing and H-1PV-infected cells from undergoing apoptosis. 293-NS1 cells grown in medium supplemented (induced) or not supplemented (noninduced) with doxycycline, and HEK-293 cells either mock treated or infected with H-1PV (MOI, 10 PFU/cell), were treated with the pan-caspase inhibitor zVAD-FMK (10 μM) for 72 h. (A, C) Cultures were analyzed by flow cytometry, as described in the legend to Fig. 5, for the determination of the sub-G1 cell population. Results are presented as average values with standard deviation bars from three independent experiments, each performed in triplicate. (B, D) Cell lysis of NS1-expressing and H-1PV-infected cells treated with zVAD-FMK was determined by LDH assay.
FIG. 7.
FIG. 7.
Involvement of ROS production in NS1-induced apoptosis. (A) The levels of ROS in control 293-NS1 cells (non ind., purple) or cells expressing NS1 in the presence (ind.+NAC, red) or absence (ind., green) of the antioxidant NAC (5 mM) were determined by loading the cells with DCFH-DA, followed by flow cytometric analysis at 24 h postinduction. (B) Representative FACS histograms showing the analysis of apoptotic cells by measuring the sub-G1 population after 72 h of growth under the conditions indicated. (C) FACS data obtained from three independent experiments performed in triplicate. Values shown are the means ± standard deviations.
FIG. 8.
FIG. 8.
ROS play a key role in the apoptotic pathway induced by H-1PV. Mock-treated parental 293 cells (MOCK) were compared with cells infected with H-1PV (MOI, 10 PFU/cell) in the presence (H-1PV+NAC) or absence (H-1PV) of NAC. Intracellular ROS levels (A), cell cycle distribution, and sub-G1 apoptotic cell population (B and C) were determined at 24 h and 72 h, respectively, as described in the legend to Fig. 7. Data shown in panel C are average values with standard deviation bars resulting from three independent experiments performed in triplicate.
FIG. 9.
FIG. 9.
H-1PV NS1 induces DNA damages via ROS production. (A) Cells were analyzed for the presence of DNA damages by immunofluorescence using an anti-γ-H2AX antibody at 24 h. NS1-expressing and H-1PV-infected cells display a specific nuclear staining pattern of γ-H2AX foci (see 100× magnification images at the top right corners). Untreated or mock-treated cells were used as a control. (B) Western blot analysis of phosphorylated H2AX levels in NS1-expressing (left) and H-1PV-infected (right) cells. NAC treatment effectively decreased the cellular levels of γ-H2AX. Actin was used as a loading control.
FIG. 10.
FIG. 10.
ROS are important mediators of H-1PV cytotoxicity in HeLa cells. (A) Twenty-four hours after infection with H-1PV (MOI, 1 PFU/cell), HeLa cells were loaded with DCFH-DA (10 μM, 1 h) and analyzed by FACS for ROS production. ROS accumulation was neutralized by the addition of the ROS scavenger GSH (5 mM). (B) Twenty-four and 48 h after infection, cell lysates were prepared and analyzed by Western blotting with the indicated antibodies. (C) Cell cycle distribution (top) and percentage of sub-G1 apoptotic cell population (bottom) of mock-treated versus H-1PV-infected cells grown in the presence or absence of GSH (5 or 10 mM). A minimum of 20,000 cells were acquired and analyzed by FACS as described in Materials and Methods. Bars represent the means with relative standard deviations from three independent experiments, each performed in triplicate.
FIG. 11.
FIG. 11.
Tentative model of H-1PV cytotoxicity. After parvovirus infection, expression of NS1 triggers an oxidative stress with accumulation of intracellular ROS associated with DNA damage. As a consequence of DNA damage, cells accumulate in G2 phase and then undergo apoptosis and ultimately lysis. NS1 may also induce DNA damage by directly nicking DNA, thereby contributing to the cell cycle arrest. Furthermore, ROS may also be produced during the execution of the apoptotic pathway, reinforcing the cytotoxic activity of the virus.

Similar articles

Cited by

References

    1. Armstrong, J. S., and M. Whiteman. 2007. Measurement of reactive oxygen species in cells and mitochondria. Methods Cell Biol. 80:355-377. - PubMed
    1. Atkuri, K. R., J. J. Mantovani, and L. A. Herzenberg. 2007. N-acetylcysteine—a safe antidote for cysteine/glutathione deficiency. Curr. Opin. Pharmacol. 7:355-359. - PMC - PubMed
    1. Bashir, T., R. Horlein, J. Rommelaere, and K. Willwand. 2000. Cyclin A activates the DNA polymerase delta-dependent elongation machinery in vitro: a parvovirus DNA replication model. Proc. Natl. Acad. Sci. U. S. A. 97:5522-5527. - PMC - PubMed
    1. Bashir, T., J. Rommelaere, and C. Cziepluch. 2001. In vivo accumulation of cyclin A and cellular replication factors in autonomous parvovirus minute virus of mice-associated replication bodies. J. Virol. 75:4394-4398. - PMC - PubMed
    1. Bodendorf, U., C. Cziepluch, J. C. Jauniaux, J. Rommelaere, and N. Salome. 1999. Nuclear export factor CRM1 interacts with nonstructural proteins NS2 from parvovirus minute virus of mice. J. Virol. 73:7769-7779. - PMC - PubMed

Publication types

MeSH terms

Substances

LinkOut - more resources