Comparative validity of 3 diabetes mellitus risk prediction scoring models in a multiethnic US cohort: the Multi-Ethnic Study of Atherosclerosis
- PMID: 20375194
- PMCID: PMC2877477
- DOI: 10.1093/aje/kwq030
Comparative validity of 3 diabetes mellitus risk prediction scoring models in a multiethnic US cohort: the Multi-Ethnic Study of Atherosclerosis
Abstract
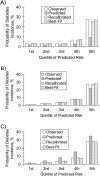
Several models for estimating risk of incident diabetes in US adults are available. The authors aimed to determine the discriminative ability and calibration of published diabetes risk prediction models in a contemporary multiethnic cohort. Participants in the Multi-Ethnic Study of Atherosclerosis without diabetes at baseline (2000-2002; n = 5,329) were followed for a median of 4.75 years. The predicted risk of diabetes was calculated using published models from the Framingham Offspring Study, the Atherosclerosis Risk in Communities (ARIC) Study, and the San Antonio Heart Study. The mean age of participants was 61.6 years (standard deviation, 10.2); 29.3% were obese, 53.1% had hypertension, 34.9% had a family history of diabetes, 27.5% had high triglyceride levels, 33.8% had low high density lipoprotein cholesterol levels, and 15.3% had impaired fasting glucose. There were 446 incident cases of diabetes (fasting glucose level >or=126 mg/dL or initiation of antidiabetes medication use) diagnosed during follow-up. C statistics were 0.78, 0.84, and 0.83 for the Framingham, ARIC, and San Antonio risk prediction models, respectively. There were significant differences between observed and predicted diabetes risks (Hosmer-Lemeshow goodness-of-fit chi-squared test for each model: P < 0.001). The recalibrated and best-fit models achieved sufficient goodness of fit (each P > 0.10). The Framingham, ARIC, and San Antonio models maintained high discriminative ability but required recalibration in a modern, multiethnic US cohort.
Figures

References
-
- King H, Aubert RE, Herman WH. Global burden of diabetes, 1995–2025: prevalence, numerical estimates, and projections. Diabetes Care. 1998;21(9):1414–1431. - PubMed
-
- Fox CS, Pencina MJ, Meigs JB, et al. Trends in the incidence of type 2 diabetes mellitus from the 1970s to the 1990s: the Framingham Heart Study. Circulation. 2006;113(25):2914–2918. - PubMed
-
- American Diabetes Association. Executive summary: standards of medical care in diabetes 2008. Diabetes Care. 2008;31(suppl 1):S5–S11. - PubMed
-
- American Diabetes Association and National Institute of Diabetes and Digestive and Kidney Diseases. The prevention or delay of type 2 diabetes. Diabetes Care. 2002;25(4):742–749. - PubMed
-
- Schmidt MI, Duncan BB, Bang H, et al. Identifying individuals at high risk for diabetes: the Atherosclerosis Risk in Communities Study. Diabetes Care. 2005;28(8):2013–2018. - PubMed
Publication types
MeSH terms
Grants and funding
- N01-HC-951605/HC/NHLBI NIH HHS/United States
- N01-HC-951602/HC/NHLBI NIH HHS/United States
- N01-HC-951601/HC/NHLBI NIH HHS/United States
- N01-HC-95159/HC/NHLBI NIH HHS/United States
- N01 HC095159/HL/NHLBI NIH HHS/United States
- N01-HC-951603/HC/NHLBI NIH HHS/United States
- N01-HC-95160/HC/NHLBI NIH HHS/United States
- 1K23DK081665/DK/NIDDK NIH HHS/United States
- K23 DK081665/DK/NIDDK NIH HHS/United States
- N01-HC-951604/HC/NHLBI NIH HHS/United States
- N01 HC095165/HL/NHLBI NIH HHS/United States
- N01 HC095169/HL/NHLBI NIH HHS/United States
- N01-HC-951609/HC/NHLBI NIH HHS/United States
LinkOut - more resources
Full Text Sources
Other Literature Sources
Medical
Molecular Biology Databases

