

Expression profiling of nuclear receptors in the NCI60 cancer cell panel reveals receptor-drug and receptor-gene interactions
- PMID: 20375240
- PMCID: PMC2875807
- DOI: 10.1210/me.2010-0040
Expression profiling of nuclear receptors in the NCI60 cancer cell panel reveals receptor-drug and receptor-gene interactions
Abstract
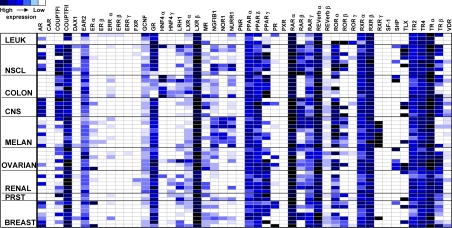
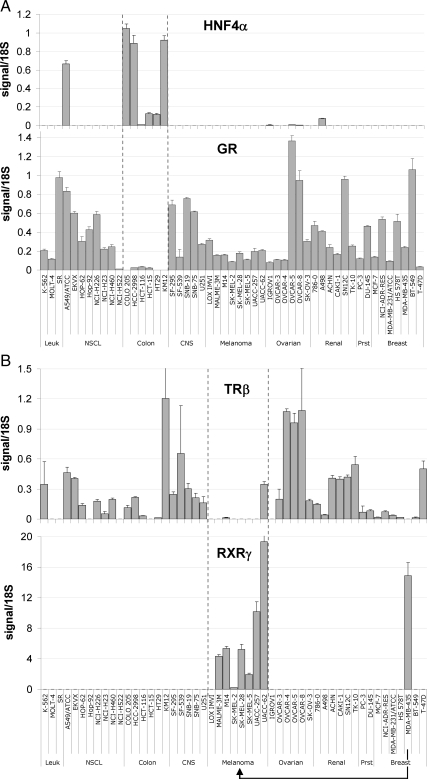
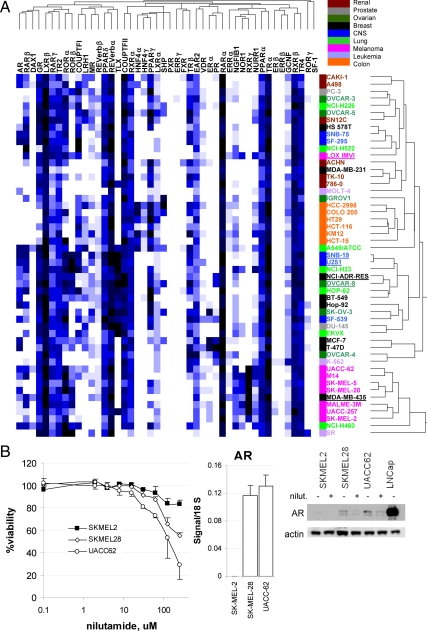
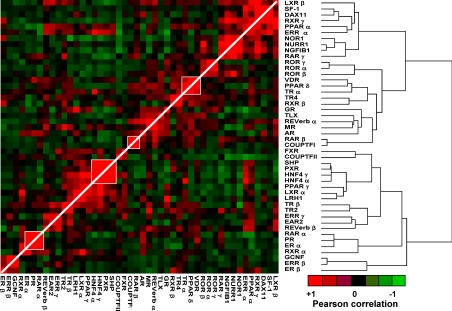
We profiled the expression of the 48 human nuclear receptors (NRs) by quantitative RT-PCR in 51 human cancer cell lines of the NCI60 collection derived from nine different tissues. NR mRNA expression accurately classified melanoma, colon, and renal cancers, whereas lung, breast, prostate, central nervous system, and leukemia cell lines exhibited heterogeneous receptor expression. Importantly, receptor mRNA levels faithfully predicted the growth-inhibitory qualities of receptor ligands in nonendocrine tumors. Correlation analysis using NR expression profiles and drug response information across the cell line panel uncovered a number of new potential receptor-drug interactions, suggesting that in these cases, individual receptor levels may predict response to chemotherapeutic interventions. Similarly, by cross-comparing receptor levels within our expression dataset and relating these profiles to existing microarray gene expression data, we defined interactions among receptors and between receptors and other genes that can now be mechanistically queried. This work supports the strategy of using NR expression profiling to classify various types of cancer, define NR-drug interactions and receptor-gene networks, predict cancer-drug sensitivity, and identify druggable targets that may be pharmacologically manipulated for potential therapeutic intervention.
Figures
Similar articles
-
Research resource: nuclear receptors as transcriptome: discriminant and prognostic value in breast cancer.Mol Endocrinol. 2013 Feb;27(2):350-65. doi: 10.1210/me.2012-1265. Epub 2013 Jan 4. Mol Endocrinol. 2013. PMID: 23292282 Free PMC article.
-
Nuclear receptor profiling in prostatospheroids and castration-resistant prostate cancer.Endocr Relat Cancer. 2018 Jan;25(1):35-50. doi: 10.1530/ERC-17-0280. Epub 2017 Oct 17. Endocr Relat Cancer. 2018. PMID: 29042395
-
Research resource: Diagnostic and therapeutic potential of nuclear receptor expression in lung cancer.Mol Endocrinol. 2012 Aug;26(8):1443-54. doi: 10.1210/me.2011-1382. Epub 2012 Jun 14. Mol Endocrinol. 2012. PMID: 22700587 Free PMC article.
-
Minireview: role of orphan nuclear receptors in cancer and potential as drug targets.Mol Endocrinol. 2014 Feb;28(2):157-72. doi: 10.1210/me.2013-1291. Epub 2013 Dec 2. Mol Endocrinol. 2014. PMID: 24295738 Free PMC article. Review.
-
[Gene expression profiles in the diagnosis and prognosis of cancer].Magy Onkol. 2002;46(1):3-9. Epub 2003 Feb 3. Magy Onkol. 2002. PMID: 12050676 Review. Hungarian.
Cited by
-
TLX, an Orphan Nuclear Receptor With Emerging Roles in Physiology and Disease.Endocrinology. 2021 Nov 1;162(11):bqab184. doi: 10.1210/endocr/bqab184. Endocrinology. 2021. PMID: 34463725 Free PMC article. Review.
-
Coexposure to phytoestrogens and bisphenol a mimics estrogenic effects in an additive manner.Toxicol Sci. 2014 Mar;138(1):21-35. doi: 10.1093/toxsci/kft271. Epub 2013 Nov 27. Toxicol Sci. 2014. PMID: 24284790 Free PMC article.
-
NCI-60 whole exome sequencing and pharmacological CellMiner analyses.PLoS One. 2014 Jul 17;9(7):e101670. doi: 10.1371/journal.pone.0101670. eCollection 2014. PLoS One. 2014. PMID: 25032700 Free PMC article.
-
Research resource: nuclear receptors as transcriptome: discriminant and prognostic value in breast cancer.Mol Endocrinol. 2013 Feb;27(2):350-65. doi: 10.1210/me.2012-1265. Epub 2013 Jan 4. Mol Endocrinol. 2013. PMID: 23292282 Free PMC article.
-
Concentration of endogenous estrogens and estrogen metabolites in the NCI-60 human tumor cell lines.Genome Med. 2012 Apr 30;4(4):31. doi: 10.1186/gm330. Genome Med. 2012. PMID: 22546321 Free PMC article.
References
-
- Castagnetta L, Granata OM, Cocciadiferro L, Saetta A, Polito L, Bronte G, Rizzo S, Campisi I, Agostara B, Carruba G 2004 Sex steroids, carcinogenesis, and cancer progression. Ann NY Acad Sci 1028:233–246 - PubMed
Publication types
MeSH terms
Substances
Grants and funding
LinkOut - more resources
Full Text Sources
Molecular Biology Databases
