. 2010 Jun;103(6):3219-37.
doi: 10.1152/jn.00904.2009. Epub 2010 Apr 7.

Frequency-dependent spatiotemporal tuning properties of non-eye movement related vestibular neurons to three-dimensional translations in squirrel monkeys

Affiliations

Frequency-dependent spatiotemporal tuning properties of non-eye movement related vestibular neurons to three-dimensional translations in squirrel monkeys

Chiju Chen-Huang et al. J Neurophysiol. 2010 Jun.

Abstract

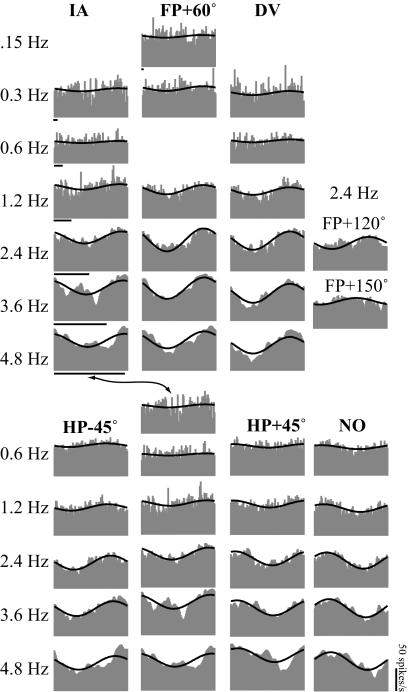
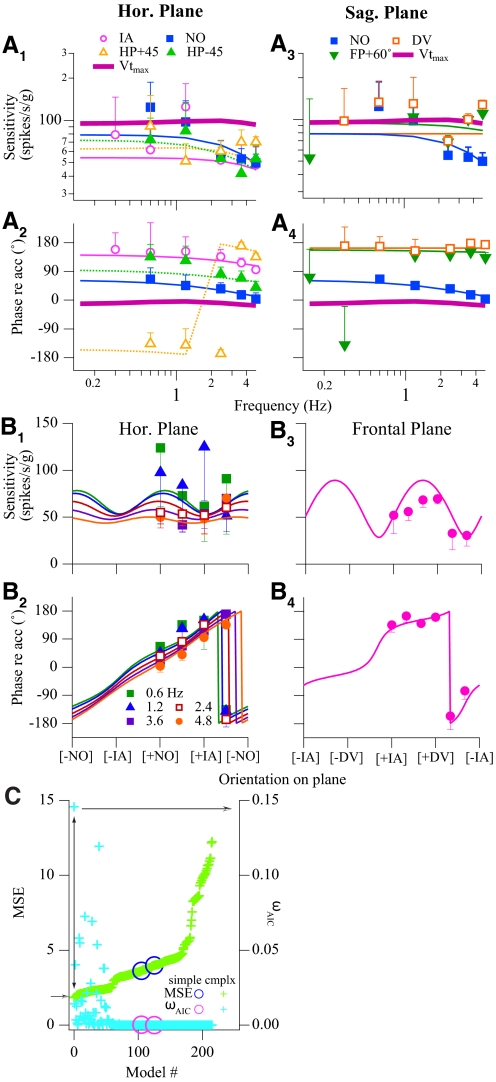
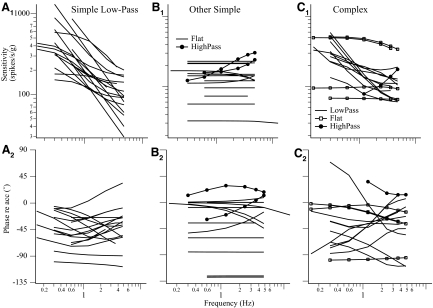
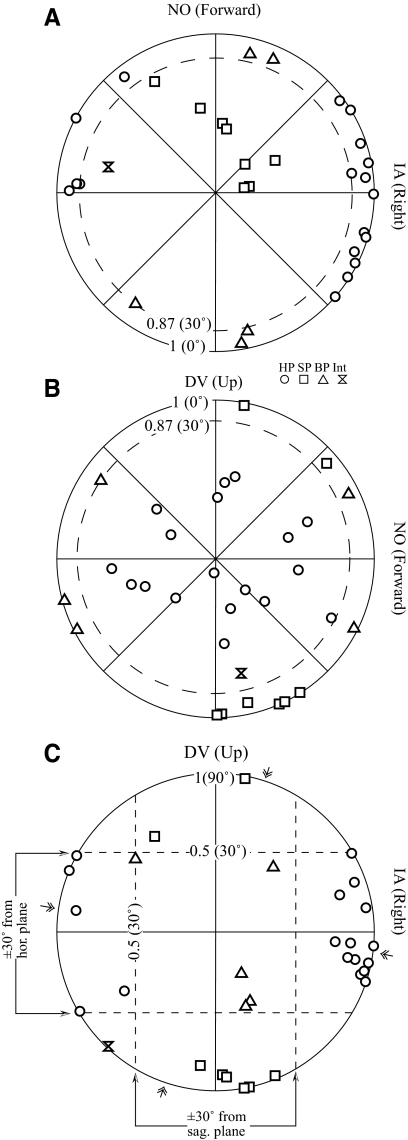
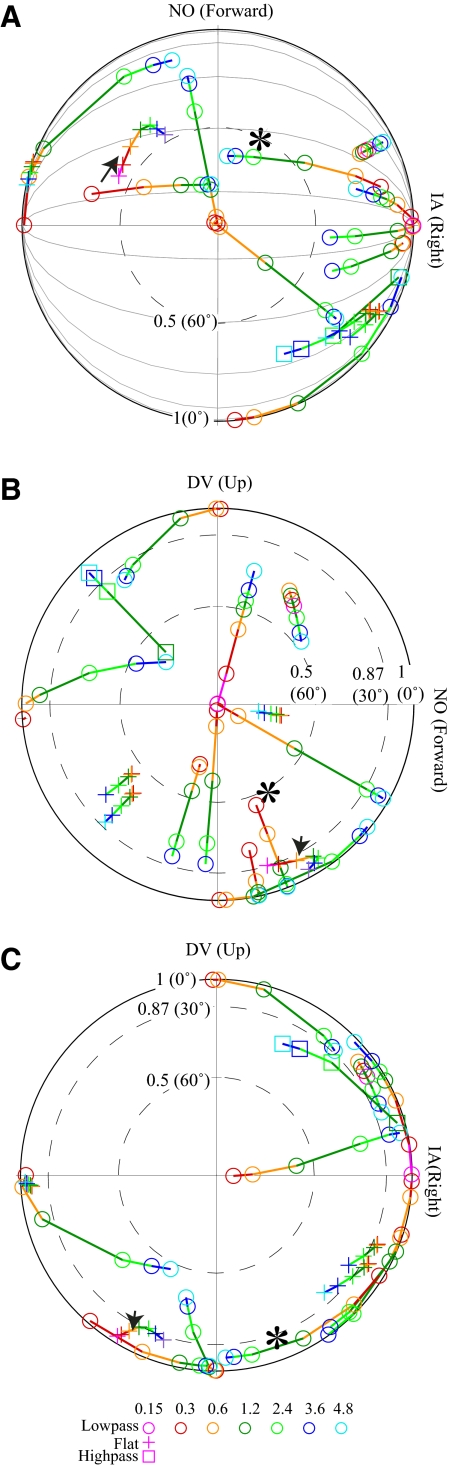
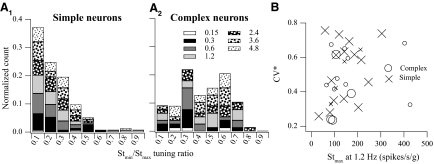
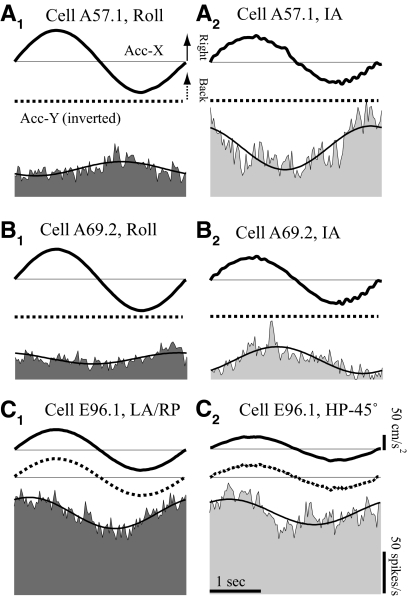
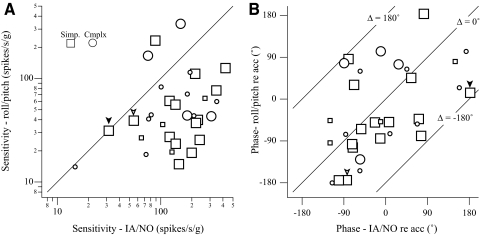
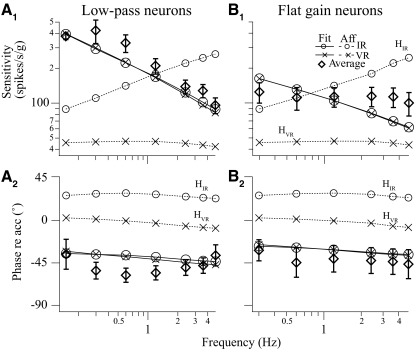
Responses of vestibular-only translation sensitive (VOTS) neurons in vestibular nuclei of two squirrel monkeys were studied at multiple frequencies to three-dimensional translations and rotations. A novel frequency-dependent spatiotemporal analysis examined in each neuron whether complex models, with unrestricted response dynamics in three-dimensional (3D) space, provided significantly better fits than restricted models following simple, cosine rule. Subsequently, the statistically selected optimal model was used to predict the maximum translation direction, expressed as a unitary vector, Vt(max), and its associated sensitivity and phase across frequencies. Simple models were sufficient to quantify the 3D translational responses of 66% of neurons. Most VOTS neurons, complex or simple, exhibited flat-gain or low-pass response dynamics. The Vt(max) of simple neurons was fixed, whereas that of complex neurons changed with frequency. The spatial distribution of Vt(max) in simple neurons, which fell within 30 degrees of either the horizontal plane or/and the sagittal plane, was closely aligned with Vt(max) of vestibular afferents. In contrast, the frequency-dependent Vt(max) of most complex neurons migrated from the dorsoventral axis at higher frequency toward the horizontal plane, especially the interaural axis, at lower frequency. When the maximum rotation direction was estimated from responses of the same VOTS neurons to 1.2 Hz yaw, pitch, and roll rotations, complex neurons were more likely to respond to rotations activating vertical canals. Responses to 0.15-0.3 Hz linear accelerations produced by inertial or gravitational forces were indistinguishable in most complex neurons but significantly different in most simple neurons. These observations suggest that simple and complex VOTS neurons constitute distinctive vestibular pathways where complex neurons, exhibiting a novel spatiotemporal filtering mechanism in processing otolith-related signals, are well suited to drive tilt-related responses, whereas simple neurons probably mediate pure translation related responses.


Figures

Fig. 1.
Fig. 1.
A: diagram of the 6-degrees-of-freedom vestibular stimulator. Motor-A rotated about the earth-vertical (yaw) axis and motor-B rotated about an earth-horizontal (pitch/roll) axis. The motor shaft of motor-B was affixed to the center of linear tracks. Motor-C was coupled to a belt-pulley system that moved motor-A and the superstructure, including a magnetic field cube, a laser/galvanometers assembly and a primate chamber, along a pair of linear tracks. Motor-A and the superstructure were attached to the linear tracks via a coupling shaft that could be manually locked at 15° intervals, with respect to the long axis of the tracks (“hole-and-peg locking mechanism”). Depending on the gaze direction of the monkey controlled by motor-A, motor-B produced roll or pitch motions and motor-C produced translations along the interaural (IA) or nasooccipital (NO) axis when the track was oriented horizontally. Translations along the dorsoventral (DV) axis were generated by orienting the linear tracks vertically. The yaw motor and suprastructure were manually locked to the tracks so that the animal always remained upright. Yaw, pitch, and roll were produced with the track at either orientation. B: the coordinate frame used in this study. Leftward yaw, right ear down, and pitch nose up rotations were positive rotations. Positive translations were rightward, forward, and upward.
Fig. 2.
Fig. 2.
Anatomical locations of recorded vestibular neurons from one squirrel monkey. Cerebellum and brain stem were sectioned in the coronal plane of electrode penetration, tilting 22° dorsocaudally and 15° laterally with respect to the stereotaxic plane. The brain was sliced at 40 μm intervals. Every fourth section was stained with Perls/3,3′-diaminobenzidene (Perls/DAB, brown), whereas its next adjacent section was stained with thionine (blue). A: confirmation of recording sites with electrolytic lesions (see methods). Currents were injected at 2 sites, 2 mm apart, near the left abducens nucleus. The only one section where electrolytic lesions were revealed with Perls/DAB stain was superimposed on its adjacent section with thionine stain. BD: line drawings, with reconstructed neurons' locations, of sections corresponding to A (B) and the following 2 sections at 0.48 (C) and 1.28 (D) mm caudal to A. Neurons located within 0.48 mm anterior/posterior to AB are shown on B (symbols). Neurons at 0.5 to <1 mm caudal to A are superimposed on C, whereas those at 1–2.5 mm caudal are shown in D. Neurons are marked as simple (red triangle) or complex (blue diamond) types. Calibration in A applies to all sections. ABD, abducens nucleus; SVN/MVN/LVN/IVN, superior/medial/lateral/inferior vestibular nucleus; ICP, inferior cerebellar peduncle; G, genu of facial nerve; PH, nucleus prepositus hypoglossi.
Fig. 3.
Fig. 3.
A typical simple vestibular-only translation sensitive (VOTS) neuron. A: action potentials (traces) evoked by 0.1 ms, 150 μA of cathodal electrical pulses delivered via a pair of chronically implanted labyrinthine electrodes in the ipsilateral ear. Occasional failure (thick trace) due to the refractory inhibition left the field potential intact. The latency for field potentials and action potentials was 0.7 and 0.9–1.3 ms, respectively. B and C: averaged responses of the same VOTS neuron to 0.6–1.2 Hz, 53–106 cm/s2 translations along the interaural (IA), nasooccipital (NO), and dorsoventral (DV) axes (B) and 2.4 Hz, 210 cm/s2 sinusoidal translations on the horizontal plane (HP) and frontal plane (FP) (C). Neural responses (shaded), aligned in time to the start of positively directed acceleration, are superimposed with the model fits (solid lines) chosen from the frequency dependent spatiotemporal fit. See Fig. 1 for the chosen coordinate frame. Time calibration bars in B and C denote 0.2 s. The arrow indicates the placement of the IA response in the frontal plane series.
Fig. 4.
Fig. 4.
Summary of the modeling results for the VOTS neuron shown in Fig. 3. A: the normalized mean square error (MSE, left ordinate, blue-green) and Akaike information criterion weight (ωAIC; right ordinate, magenta-light blue) obtained from all successfully converged models were computed with the frequency-spatiotemporal fits. Both quantities are plotted according to the ascending order of MSE. Each model is labeled with the same marker style but different colors (e.g., the paired circles indicated by the double arrowheaded line). The simple model with the highest ωAIC (=0.65; magenta circle with arrow) also had a very low MSE (0.35, blue circle with arrow), indicating that this was the most parsimonious model of all models tested. B: comparison of actual and predicted responses from the chosen model indicated in A. Bode plots, i.e., sensitivity and phase vs. frequency, of actual (markers) and predicted (thick lines) responses, are plotted along the IA, NO, and DV axes. Estimated response dynamics in the intermediate orientations, sampled at a 15° interval, are also shown (thin lines). Note that although matching sensitivity and phase curves are graphed, only 2 stacks of phase curves are visible. C: spatial tuning curves of the same VOTS neuron in the horizontal and frontal planes. Actual (markers) response sensitivity and phase vs. translation directions are superimposed on the estimated responses from the global frequency-spatiotemporal model (solid lines). In addition, unrestricted, independent 2-dimensional fits to the horizontal and sagittal plane data are shown in dashed lines. The 2 identical peaks in the sensitivity plots correspond to peak responses in the excitatory and inhibitory directions. Error bars (SEs) in B and C are shown in one direction and may be obscured by symbols.
Fig. 5.
Fig. 5.
Averaged responses of a complex VOTS neuron to 0.15–4.8 Hz, 38–300 cm/s2 sinusoidal translations along IA, NO, and DV axes and along intermediate orientations on the horizontal plane (HP) and frontal plane (FP). Neural responses (shaded), aligned with the acceleration in time, are superimposed with the model fits (solid lines) chosen from the frequency-dependent spatiotemporal fit. Time calibration bars denote 0.2 s. The firing rate calibration bar applies to all graphs. See Fig. 1 for the chosen coordinate frame. Note that IA responses are repeated and presented in both plane series (arrow).
Fig. 6.
Fig. 6.
Summary of modeling results for the VOTS neuron shown in Fig. 5. The chosen model had the following parameters: Sx = −54.2, τ1-x = 0.023, kx = 0.21; Sy = 78.7, τ1-y = 0.041, ky = −0.35; Sz = −78.7, kz = 0.10. A: Bode plots, i.e., sensitivity and phase vs. frequency, of actual (markers) and modeled (thin solid or dashed lines) responses along the IA, NO, DV, HP +45°, HP −45°, and FP +60° axes. The estimated responses in maximum translation response vectors (Vtmax) are also shown (thick purple lines). B: spatial tuning property of the same VOTS neuron in the horizontal (0.6–4.8 Hz) and frontal (2.4 Hz) planes. Actual (markers) and modeled (lines) responses are plotted against orientation angle on each plane. The selection of this complex model, which accounted for 90% of variance, was deemed necessary, as shown in C. Normalized MSEs (left ordinate) and ωAIC (right ordinate) obtained from all successfully converged models are plotted according to the ascending order of MSE. The complex model that produced a low MSE and high ωAIC (crosses linked by the double arrowheaded line) was chosen (see text). Error bars (SEs) in A and B are shown in one direction and may be obscured by symbols.
Fig. 7.
Fig. 7.
Response dynamics of the 47 VOTS neurons along the Vtmax estimated from their respective chosen model based on the frequency-dependent spatiotemporal analysis. The Stmax and ϕtmax of low-pass VOTS simple neurons are plotted in A, whereas those of the flat-gain (line) and high-pass (circles) simple neurons are plotted in B. Likewise, the predicted Stmax and ϕtmax of complex neurons that exhibited low-pass, high-pass, or flat dynamics are plotted in C. Responses were reconstructed at the frequency at which neural recordings were made. Neurons with an averaged sensitivity slope ≤4 or ≥ −4 dB/decade were classified as flat dynamics, >4 dB/decade were high-pass, and < −4 dB/decade were low-pass.
Fig. 8.
Fig. 8.
Projections of Vtmax for simple VOTS neurons onto the horizontal (HP, A), sagittal (SP, B), and frontal (FP, C) planes. Vectorial length and polar angle denote the projected component magnitude and direction onto each plane. Simple neurons were classified as HP or SP type if the angular deviation of Vtmax from the horizontal or sagittal plane, respectively, was <30°. Thus the length of projected vectors onto these planes was ≥0.87 (dashed circles, A and B) and fell within the ±30° latitude parallels on the FP (dashed lines, C). Both-plane (BP) neurons lay near both planes, whereas one intermediate (Int) neuron was near neither. Symbols indicate neuron's planar preference. The map was tilted forward 15° from the stereotaxic plane, as how the animal's head was held. Double arrows on the perimeter of polar plot C denote the mean polarization vectors of otolith afferents recorded from the superior and inferior vestibular nerves (Fernandez and Goldberg 1976b).
Fig. 9.
Fig. 9.
Projections of frequency-related Vtmax for complex neurons onto the horizontal (A), sagittal (B), and frontal (C) planes. Symbols indicate neuron's dynamics, whereas colors/line styles code frequency-related migration of Vtmax. Vectorial length and polar angle denote the projected component magnitude and direction onto each plane. Gray thin lines in A illustrate great circles (meridians) through ±IA pole sliced at 15° interval. The projected circles of latitude (dashed lines) correspond to vectorial angular deviation of 30° (radius = 0.87) or 60° (r = 0.5) away from a given plane. The neuron tagged by an arrowhead was the same neuron shown in Figs. 5 and 6. The map was tilted forward 15° from the stereotaxic plane, as how the animal's head was held.
Fig. 10.
Fig. 10.
A: distribution histogram of the 3D tuning ratio, Stmin/Stmax, in simple (A1) and complex (A2) neurons at various frequencies (see legend). The ordinate lists count fractions normalized with respect to the total number of cases in each class. B: distribution of normalized coefficient of variation (CV*), to t = 15 ms, with respect to the maximum translation sensitivity (Stmax) at 1.2 Hz. Simple (cross) and complex (circle) VOTS neurons that exhibited significant differential responses during 0.3 Hz tilts and translation are emphasized with larger symbols.
Fig. 11.
Fig. 11.
Projections of unitary maximum rotational (Vrmax–HP, A) and translational (Vtmax–HP, B) response vectors during 1.2 Hz 20°/s rotation or 14 cm/s translation onto the horizontal plane. Only neurons that responded significantly to 1.2 Hz HA rotations are shown. The polar graph for Vrmax–HP was remapped so that the direction of gravitation-inertial force (GIF) during rotation and translation was aligned, i.e., pitch-nose up rotation to forward translation and right ear down (RED) rotation to leftward translation. Rotation vectors corresponding to left anterior/posterior canal (LAC/LPC) and right anterior/posterior canal (RAC/RPC) are also shown in A. C: comparison of the orientation of Vtmax–HP and Vrmax–HP in HA rotation sensitive VOTS neurons (symbols). The line of unity denotes congruent spatial responses of VOTS neurons to HA rotations and GIF. Distance between tick marks is 90°. The polar angle for each orientation was chosen to minimize angular differences between paired Vtmax–HP and Vrmax–HP. D: distribution of the angular alignment differences between Vrmax–HP and Vtmax–HP in selected HA rotation VOTS neurons whose Vtmax at 1.2 Hz was not predominantly along the DV axis, i.e., the magnitude of vector length on the horizontal plane >0.6 (dashed line in B).
Fig. 12.
Fig. 12.
Exemplary VOTS neurons in which diverse GIF-related responses during 0.3 Hz HA rotations and HP translations were observed. The GIFs produced during 0.3 Hz HA rotations and horizontal plane translations are similar in profile. Responses to 0.3 Hz, 10°/s roll (A, B) or left-anterior–right-posterior (LA–RP, C) rotations and to 0.3 Hz 75 cm/s2 IA (A, B) or HP −45° (C) translations are shown for a simple (A) and 2 complex (B, C) VOTS neurons. The peak effective GIF in the horizontal plane, i.e., the vector sum of accelerations along the IA (Acc-X, thick solid lines) and NO (Acc-Y, thick dashed lines) axes recorded by a head-mounted triaxial accelerometer, in roll/LA–RP was 0.092 and 0.076 g in translations. Average neural responses (shaded) are superimposed with sinusoidal fits. For graphing purposes, Y-axis (NO) acceleration records are inverted so that neural responses are aligned with rightward IA and backward NO. Calibration bars in C apply to all graphs.
Fig. 13.
Fig. 13.
A: paired comparison of response sensitivity (A) and phase (B) tested during 0.3 Hz, 0.076 g, horizontal plane translations vs. 0.3 Hz 10°/s HA rotations that produced similar GIFs (0.092 g). Responses were computed as raw modulation (spikes/s) with respect to effective GIFs (g) evoked during translations and rotations. Thus the sensitivity and phase during rotations are expressed with respect to linear acceleration, not the customary angular velocity. The line of unity in A denotes equality in their rotation vs. translation responses. The lines in B demarcate phase differences of −180, 0, and +180°. Phase values are expressed with respect to the positive, not necessarily the excitatory, stimulus direction, i.e., rightward/forward translations. Neurons responding to paired 0.3 Hz dynamic tilts and translations with significant difference (paired t-test) are noted with larger markers. The inverted arrowheads highlight 2 neurons where the sensitivities to tilts and translations are similar yet phase differences are very large.
Fig. 14.
Fig. 14.
Comparisons of average responses of simple VOTS neurons to 2 classes of otolith afferents across frequency. The frequency-dependent sensitivity and phase of low-pass neurons (A) and flat-gain neurons (B) are adequately modeled with a fractional leaky integrator, in the form of ks*(1 + τps)h, −1 < h < 0, with very regular (HVR, h ≅ −0.3) or irregular (HIR, h ≅ −0.7) afferent inputs at test frequencies. Afferent responses were obtained from previously published data in squirrel monkeys (Goldberg et al. 1990).

Similar articles

Cited by

References

    1. Angelaki DE. Spatio-temporal convergence (STC) in otolith neurons. Biol Cybern 67: 83–96, 1992 - PubMed
    1. Angelaki DE. Spatial and temporal coding in single neurons. Biol Cybern 69: 147–154, 1993 - PubMed
    1. Angelaki DE. Three-dimensional organization of otolith-ocular reflexes in rhesus monkeys. III. Responses to translation. J Neurophysiol 80: 680–695, 1998 - PubMed
    1. Angelaki DE, Bush GA, Perachio AA. A model for the characterization of the spatial properties in vestibular neurons. Biol Cybern 66: 231–240, 1992 - PubMed
    1. Angelaki DE, Dickman JD. Spatiotemporal processing of linear acceleration: primary afferent and central vestibular neuron responses. J Neurophysiol 84: 2113–2132, 2000 - PubMed

Publication types

LinkOut - more resources