. 2010 Jun;103(6):3205-18.
doi: 10.1152/jn.00971.2009. Epub 2010 Apr 7.

Properties of GABAergic neurons in the rostral solitary tract nucleus in mice

Affiliations

Properties of GABAergic neurons in the rostral solitary tract nucleus in mice

Min Wang et al. J Neurophysiol. 2010 Jun.

Abstract

The rostral nucleus of the solitary tract (rNST) plays a pivotal role in taste processing. The rNST contains projection neurons and interneurons that differ in morphology and intrinsic membrane properties. Although characteristics of the projection neurons have been detailed, similar information is lacking on the interneurons. We determined the intrinsic properties of the rNST GABAergic interneurons using a transgenic mouse model that expresses enhanced green fluorescent protein under the control of a GAD67 promoter. Glutamic acid decarboxylase-green fluorescent protein (GAD67-GFP) neurons were distributed throughout the rNST but were concentrated in the ventral subdivision with minimal interaction with the terminal field of the afferent input. Furthermore, the density of the GAD67-GFP neurons decreased in more rostral areas of rNST. In whole cell recordings, GAD67-GFP neurons responded with either an initial burst (73%), tonic (18%), or irregular (9%) discharge pattern of action potentials (APs) in response to membrane depolarization. These three groups also differed in passive and AP characteristics. Initial burst neurons had small ovoid or fusiform cell bodies, whereas tonic firing neurons had large multipolar or fusiform cell bodies. Irregular firing neurons had larger spherical soma. Some of the initial burst and tonic firing neurons were also spontaneously active. The GAD67-GFP neurons could also be categorized in subgroups based on colocalization with somatostatin and parvalbumin immunolabeling. Initial burst neurons would transmit the early dynamic portion of the encoded sensory stimuli, whereas tonic firing neurons could respond to both dynamic and static components of the sensory input, suggesting different roles for GAD67-GFP neurons in taste processing.


Figures

Fig. 1.
Fig. 1.
Distribution of glutamic acid decarboxylase–green fluorescent protein (GAD–GFP) neurons in the rostral nucleus of solitary tract (rNST) in mouse brain stem. A: horizontal section of the mouse brain stem stained with Luxol fast blue and cresyl violet to show the NST. The blue stained solitary tracts (STs) are located adjacent to the lateral border of the nucleus. R, rostral; L, lateral. B: a similar horizontal section from a GIN (GFP-expressing inhibitory neurons) mouse showing the fluorescently labeled GFP neurons. A dense band of GFP neurons is located lateral to the ST in the caudal NST (arrowheads). A further concentration of GAD67–GFP neurons is localized in the more rostral medial NST (asterisks). Bar = 200 μm. CE: selected coronal sections of the rNST at the levels indicated in A. The standard subdivisions of the rNST are outlined in E. M, medial subdivision; RC, rostral-central subdivision; RL, rostral lateral subdivision; V, ventral subdivision. GFP neurons are densely concentrated in the V subdivision. The other subdivisions also contained some GFP positive neurons. The RC subdivision had the least amount of GFP neurons. ST, solitary tract. Inset in E is a low magnification photomicrograph of the right dorsal quadrant of a coronal section of the brain stem, indicating the location of the higher magnification images of C, D, and E (white box outlines location of higher magnification images). Bar in both high and low magnification images = 100 μm. The C, D, E series of selected coronal sections are arranged from rostral (C) to caudal (E) rNST. There is 150 μm distance between C and D and 100 μm between D and E. GFP neurons gradually decreased in density from caudal to rostral NST. Bar = 100 μm. F: total counts of GAD67–GFP neurons in all subdivisions of rNST coronal sections at different caudal to rostral distances from the obex. The number of cases used to calculate each point is indicated above each data point.
Fig. 2.
Fig. 2.
Terminal field pattern of chorda tympani (CT) and glossopharyngeal (IX) afferent nerves in GIN mice. A: fluorescently labeled (red) CT nerve terminal field in rostral–caudal serial sections. Top panel shows the entrance of the CT nerve followed by panels of serial sections of NST from rostral to caudal. The numbers on the right of the sections are the distances between the sections and the obex. Bar = 100 μm. B: fluorescently labeled (red) IX nerve terminal field in a rostral–caudal serial sections. Top panel shows the entrance of the IX nerve followed by panels of serial sections of NST from rostral to caudal. The numbers on the right of the sections are the distances between the sections relative to the obex. D, dorsal; M, medial. Bar = 100 μm. C: higher magnification image of CT terminal field showing that the afferent fibers are mainly restricted to the rostral-central subdivision with minimal penetration into the ventral subdivision where GFP neurons are located. Bar = 100 μm. C1, C2, C3: higher magnification images of C at the 3 indicated locations, illustrating minimal penetration of the terminal field fibers into the ventral subdivision. Bar = 10 μm.
Fig. 3.
Fig. 3.
Colocalization of GFP neurons with NeuN and γ-aminobutyric acid (GABA). A: colocalization of NeuN (red) positive cells with a subpopulation of GFP (green) cells in rNST. a1, a2, a3: higher magnification of the area outlined, showing colocalized GFP and NeuN positive cells (arrows) in the merged image. B: colocalization of GABA (red) positive and GFP neurons. Bar = 100 μm. b1, b2, b3: higher magnification of the area outlined in B, showing colocalization of GABA positive and GFP neurons (arrows) in the merged images. Bar = 10 μm.
Fig. 4.
Fig. 4.
Repetitive firing patterns of the rNST GFP neuron responses to a 1,000 ms depolarizing current pulse. A1: initial burst firing. B1: tonic firing. C1: irregular firing. A2, B2, C2: recorded at membrane potential set at −60 mV by bias current injection. Repetitive firing patterns of the same GFP neurons to a 100 ms hyperpolarizing current pulse followed by a 1,000 ms depolarizing current pulse at resting membrane potential. Membrane hyperpolarization had no effect on the repetitive discharge pattern evoked by membrane depolarization. A3, B3, C3: responses of the same neurons to a series of hyperpolarizing and depolarizing current injections at the neuron resting membrane potential. Note the membrane sag in B3 (arrow).
Fig. 5.
Fig. 5.
Voltage-clamp recordings from rNST GFP and non-GFP-labeled neurons. GFP neuron responds to hyperpolarization followed by depolarization without an initial outward current (A1, A2, A3). In contrast the non-GFP neuron responded to the same voltage protocol with an initial transient outward current (B1) that is blocked by application of 4-aminopyridine (4-AP, B2). B3 is an arithmetical subtraction of the membrane voltage records in B1 and B2.
Fig. 6.
Fig. 6.
rNST GAD67–GFP neuron morphology. Examples of Lucifer yellow injected neurons of each of the 3 firing patterns are illustrated in A, B, and C with tracings of the same neurons in D, E, and F. Bar = 10 μm. G: location of filled neurons mapped onto a diagram of a coronal section of the left rNST. All neurons are of the initial burst pattern except those marked TF (tonic firing) and IF (irregularly firing). Bar = 250 μm. H and I: comparison of the morphometric characteristics of the soma and dendrites of neurons with burst, tonic, and irregular firing patterns. Data are presented as means ± SE. Asterisks (*) indicate significant differences between the means at the P < 0.05 level.
Fig. 7.
Fig. 7.
Passive and action potential (AP) characteristics of initial burst, tonic, and irregular firing GFP neuron groups. AC: passive membrane properties. DI: AP characteristics. The numbers of neurons in each group are indicated in A and data are presented as the mean ± SE. Asterisks (*) indicate significant differences between means at the P < 0.05 level. JL: examples of the APs of initial burst, tonic, and irregular firing neuron groups.
Fig. 8.
Fig. 8.
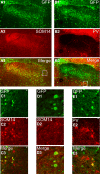
Distribution of somatostatin and parvalbumin immunoreaction in GIN mouse rNST. A: somatostatin positive fibers are distributed throughout the rNST. A1: GFP neurons (green). A2: somatostatin positive fibers (red). A3: merged image showing GFP and somatostatin immunoreaction. B: parvalbumin is largely absent from the rNST. Bar = 100 μm. B1: GFP neurons (green). B2: parvalbumin positive immunoreaction (red). B3: merged images of GFP and parvalbumin immunoreaction. C1C3: higher magnification images of colocalized somatostatin and GFP neurons indicated in the white box in A3. Bar = 10 μm. D1D3: higher magnification images of the somatostatin immunoreacted fibers and GFP neurons in the rostral-central subdivision. In the merged image (D3) the GFP neurons are observed to be surrounded by somatostatin-positive fibers. Bar = 10 μm. E1E3: higher magnification images of colocalized parvalbumin and GFP neurons. E1: few GFP neurons in rNST colocalize with parvalbumin except at the ventral border (box in B3).

Similar articles

Cited by

References

    1. Bailey TW, Appleyard SM, Jin YH, Andresen MC. Organization and properties of GABAergic neurons in solitary tract nucleus (NTS). J Neurophysiol 99: 1712–1722, 2008 - PubMed
    1. Barry MA, Halsell CB, Whitehead MC. Organization of the nucleus of the solitary tract in the hamster: acetylcholinesterase, NADH dehydrogenase, and cytochrome oxidase histochemistry. Microsc Res Tech 26: 231–244, 1993 - PubMed
    1. Beckman ME, Whitehead MC. Intramedullary connections of the rostral nucleus of the solitary tract in the hamster. Brain Res 557: 265–279, 1991 - PubMed
    1. Bradley RM. The Role of the Nucleus of the Solitary Tract in Gustatory Processing Boca Raton, FL: CRC Press, 2006 - PubMed
    1. Bradley RM, Sweazey RD. Separation of neuron types in the gustatory zone of the nucleus tractus solitarii based on intrinsic firing properties. J Neurophysiol 67: 1659–1668, 1992 - PubMed

Publication types

MeSH terms

LinkOut - more resources