

Experimental snapshots of a protein-DNA binding landscape
- PMID: 20375284
- PMCID: PMC2867883
- DOI: 10.1073/pnas.0911734107
Experimental snapshots of a protein-DNA binding landscape
Abstract
Protein recognition of DNA sites is a primary event for gene function. Its ultimate mechanistic understanding requires an integrated structural, dynamic, kinetic, and thermodynamic dissection that is currently limited considering the hundreds of structures of protein-DNA complexes available. We describe a protein-DNA-binding pathway in which an initial, diffuse, transition state ensemble with some nonnative contacts is followed by formation of extensive nonnative interactions that drive the system into a kinetic trap. Finally, nonnative contacts are slowly rearranged into native-like interactions with the DNA backbone. Dissimilar protein-DNA interfaces that populate along the DNA-binding route are explained by a temporary degeneracy of protein-DNA interactions, centered on "dual-role" residues. The nonnative species slow down the reaction allowing for extended functionality.
Conflict of interest statement
The authors declare no conflict of interest.
Figures
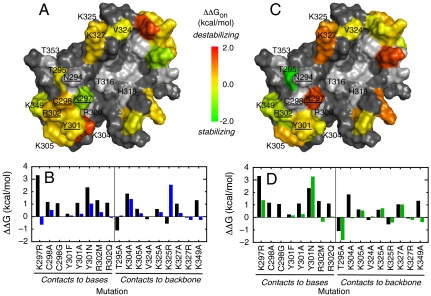
 on the surface of the DNA-bound conformation of the HPV16 E2C homodimer (23). Relevant residues are labeled in a single monomer for clarity. Residues in α1 contacting the DNA bases as deduced from homologous E2C-DNA complexes, mutagenesis, and biophysical measurements (, –26) (N294, K297, C298, Y301, and R302) are Underlined. Residues N294, K297, Y301, and R302 also form nonspecific contacts with the DNA backbone as well as two other residues in α1, T295 and R300 (, –26). K304 and K305 from the 310 helix; V324, K325, and K327 from the β2-β3 loop; and T316, H318, K349, and T353 outside of the major recognition elements also form nonspecific contacts with the DNA backbone (23, 24, 26). Residues are colored according to changes in free energy upon mutation to alanine, except for K297R, R300M, and R302M. Uncharacterized residues are colored gray. (B) Comparison of the effects on
  (Blue Bars) and on the final complex (Black Bars). (C) Representation of the effects on
  on the surface of the DNA-bound conformation of the HPV16 E2C homodimer (23). (D) Comparison of the effects on
  (Green Bars) and on the final complex (Black Bars).

 . (C) Final complex vs.
 . (D) TSE2-state vs.
  . (E) TSE2-state vs.
  . (F)
. (F)  vs.
vs.  .
.
 . Dissociation of the native complex may take place over TSE2-state or
  .
.Similar articles
-
Predicting indirect readout effects in protein-DNA interactions.Proc Natl Acad Sci U S A. 2004 Jun 1;101(22):8337-41. doi: 10.1073/pnas.0402319101. Epub 2004 May 17. Proc Natl Acad Sci U S A. 2004. PMID: 15148366 Free PMC article.
-
Mutational analysis of kinetic partitioning in protein folding and protein-DNA binding.Protein Eng Des Sel. 2011 Jan;24(1-2):179-84. doi: 10.1093/protein/gzq064. Epub 2010 Sep 27. Protein Eng Des Sel. 2011. PMID: 20876193 Free PMC article.
-
Human papillomavirus type 16 E7 protein inhibits DNA binding by the retinoblastoma gene product.Mol Cell Biol. 1992 May;12(5):1905-14. doi: 10.1128/mcb.12.5.1905-1914.1992. Mol Cell Biol. 1992. PMID: 1314947 Free PMC article.
-
Thermodynamic and kinetic analyses for understanding sequence-specific DNA recognition.Genes Cells. 2000 May;5(5):319-26. doi: 10.1046/j.1365-2443.2000.00335.x. Genes Cells. 2000. PMID: 10886361 Review.
-
Modulation of DNA-binding domains for sequence-specific DNA recognition.Gene. 2003 Jan 30;304:1-12. doi: 10.1016/s0378-1119(02)01207-6. Gene. 2003. PMID: 12568710 Review.
Cited by
-
Nonnative interactions in coupled folding and binding processes of intrinsically disordered proteins.PLoS One. 2010 Nov 4;5(11):e15375. doi: 10.1371/journal.pone.0015375. PLoS One. 2010. PMID: 21079758 Free PMC article.
-
Regulation of the H4 tail binding and folding landscapes via Lys-16 acetylation.Proc Natl Acad Sci U S A. 2012 Oct 30;109(44):17857-62. doi: 10.1073/pnas.1201805109. Epub 2012 Sep 17. Proc Natl Acad Sci U S A. 2012. PMID: 22988066 Free PMC article.
-
Thermodynamics of cooperative DNA recognition at a replication origin and transcription regulatory site.Biochemistry. 2010 Dec 7;49(48):10277-86. doi: 10.1021/bi1014908. Epub 2010 Nov 10. Biochemistry. 2010. PMID: 21047141 Free PMC article.
-
Frustration in biomolecules.Q Rev Biophys. 2014 Nov;47(4):285-363. doi: 10.1017/S0033583514000092. Epub 2014 Sep 16. Q Rev Biophys. 2014. PMID: 25225856 Free PMC article. Review.
-
Investigating dynamic and energetic determinants of protein nucleic acid recognition: analysis of the zinc finger zif268-DNA complexes.BMC Struct Biol. 2010 Nov 24;10:42. doi: 10.1186/1472-6807-10-42. BMC Struct Biol. 2010. PMID: 21106075 Free PMC article.
References
-
- Record MT, Jr, Ha JH, Fisher MA. Analysis of equilibrium and kinetic measurements to determine thermodynamic origins of stability and specificity and mechanism of formation of site-specific complexes between proteins and helical DNA. Methods Enzymol. 1991;208:291–343. - PubMed
-
- von Hippel PH, Berg OG. Facilitated target location in biological systems. J Biol Chem. 1989;264:675–678. - PubMed
-
- Ferreiro DU, Prat Gay Gd. A protein-DNA binding mechanism proceeds through multi-state or two-state parallel pathways. J Mol Biol. 2003;331:89–99. - PubMed
-
- Parkhurst KM, Richards RM, Brenowitz M, Parkhurst LJ. Intermediate species possessing bent DNA are present along the pathway to formation of a final TBP-TATA complex. J Mol Biol. 1999;289:1327–1341. - PubMed
Publication types
MeSH terms
Substances
Grants and funding
LinkOut - more resources
Full Text Sources
Molecular Biology Databases
