. 2009 Dec;5(4):479-496.
doi: 10.1007/s11306-009-0169-z. Epub 2009 Jul 24.

Inter-laboratory reproducibility of fast gas chromatography-electron impact-time of flight mass spectrometry (GC-EI-TOF/MS) based plant metabolomics

Inter-laboratory reproducibility of fast gas chromatography-electron impact-time of flight mass spectrometry (GC-EI-TOF/MS) based plant metabolomics

J William Allwood et al. Metabolomics. 2009 Dec.

Abstract

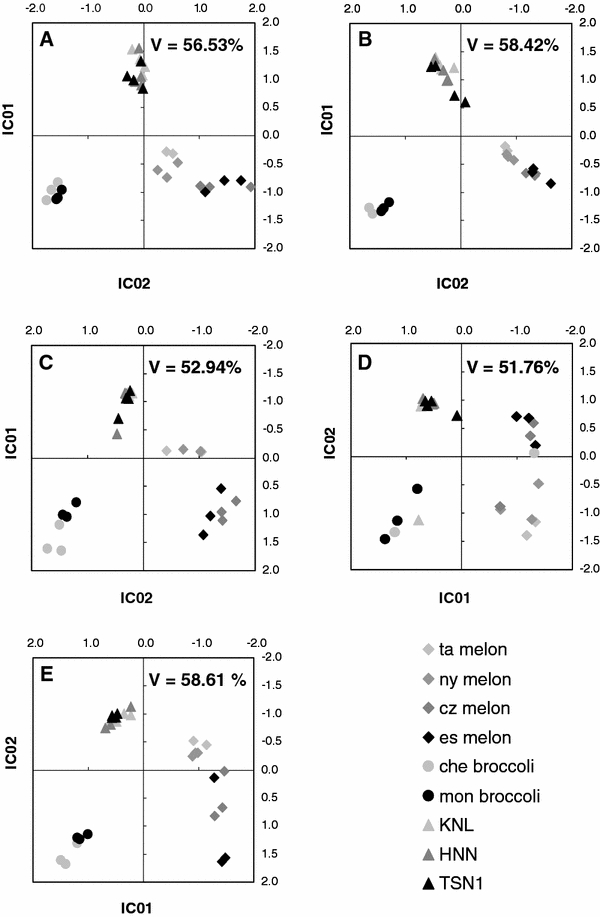
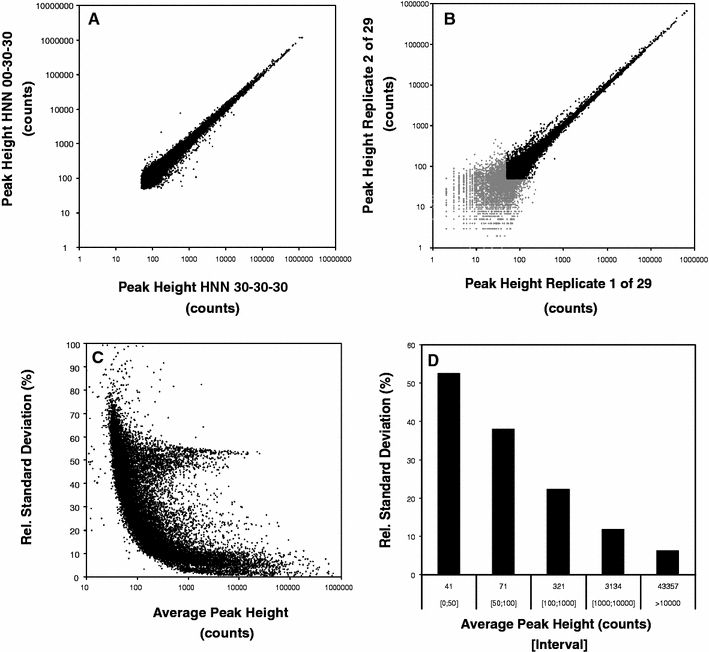
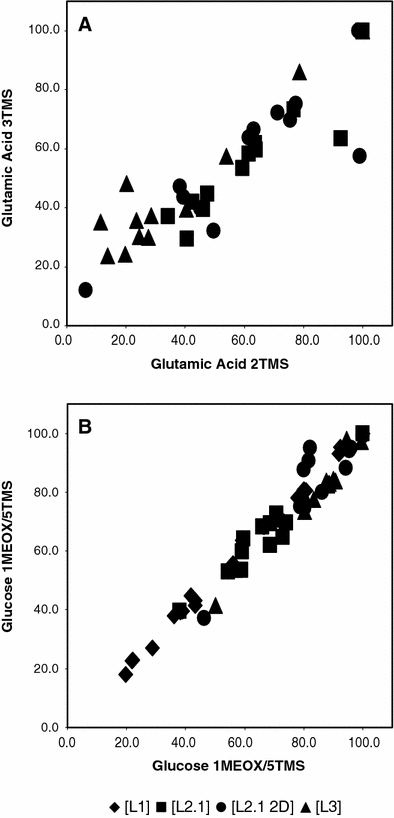
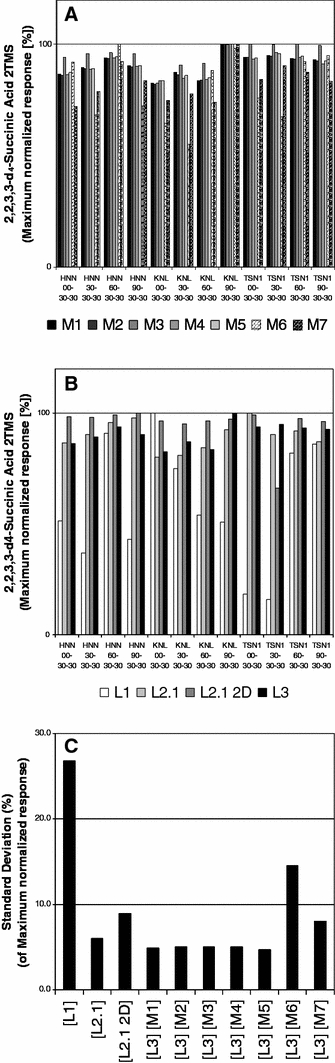
The application of gas chromatography-mass spectrometry (GC-MS) to the 'global' analysis of metabolites in complex samples (i.e. metabolomics) has now become routine. The generation of these data-rich profiles demands new strategies in data mining and standardisation of experimental and reporting aspects across laboratories. As part of the META-PHOR project's (METAbolomics for Plants Health and OutReach: http://www.meta-phor.eu/) priorities towards robust technology development, a GC-MS ring experiment based upon three complex matrices (melon, broccoli and rice) was launched. All sample preparation, data processing, multivariate analyses and comparisons of major metabolite features followed standardised protocols, identical models of GC (Agilent 6890N) and TOF/MS (Leco Pegasus III) were also employed. In addition comprehensive GCxGC-TOF/MS was compared with 1 dimensional GC-TOF/MS. Comparisons of the paired data from the various laboratories were made with a single data processing and analysis method providing an unbiased assessment of analytical method variants and inter-laboratory reproducibility. A range of processing and statistical methods were also assessed with a single exemplary dataset revealing near equal performance between them. Further investigations of long-term reproducibility are required, though the future generation of global and valid metabolomics databases offers much promise.


Figures

Fig. 1
Fig. 1
Comparative independent component analysis demonstrates the reproducibility of sample discrimination between laboratories and method variations. ae shows independent component analyses based on the first two principal components of a PCA preprocessing. The visualised percentage of total variance (V) is indicated. a shows data of UMAN after metabolite targeted data processing, method combination [L1] and [M7]. b is based on fingerprinting the data set of UMAN with methods [L1] and [M1]. c compares fingerprinting data of LECO with method [L2.1] and [M1] to GC×GC-fingerprinting data (d) of the same laboratory using method [L2.1 2D] and [M1]. e demonstrates the fingerprinting results of MPIMP using the method combination [L3] and [M2]
Fig. 2
Fig. 2
Analyses of technical replicate profiles. a, b compares the reproducibility of all mass spectral features from technical replicates (b) to biological replicates of highly similar rice samples (a, cf. to samples of Figs. 4, 5). The peak-heights (counts) of all aligned acquired mass fragments are plotted. a is limited to 50 counts minimum using the baseline correction integrated in method [M2]. b also processed by [M2] demonstrates the validity of the 50 count cut-off (grey format). c summarises the relative standard deviations (RSDs) of all aligned mass spectral features from an MPIMP experiment comprising 29 technological replicate chromatograms. Note that the population of intense features at 50–60% RSD is caused by reagent contaminations. d demonstrates the expected technological RSDs with regard to choice of peak intensity (count) range as a histogram
Fig. 3
Fig. 3
Stability of alternative chemical derivatives. The normalised responses after internal standardisation of alternative glutamate (a) and glucose (b) derivatives are shown. The high agreement of the METAPHOR data [L1], [L2.1], [L2.1 2D], [L3], processed by [M1] is demonstrated. For analysis of the resilient biological matrices or unstable metabolite derivatives, specific stable isotope labelled standards will enhance accuracy. Note that glutamic acid 2TMS was not detectable in [L1]
Fig. 4
Fig. 4
Technical reproducibility evaluated by the internal standard, d4-succinic acid (2TMS). Response data were maximum normalised for comparison of the data-mining methods [M1] to [M7] using exemplary [L3] data (a). b compares maximum normalised d4-succinic acid (2TMS) response between laboratories [L1] to [L3] using processing method [M1]. The respective standard deviations of each of the previous calculations are reported in (c) with laboratory and method combinations indicated
Fig. 5
Fig. 5
Comparisons of endogenous metabolite levels using responses normalised to the d4-succinic acid internal standard. Metabolites were chosen to represent the borderline of potential distinctive features, such as a, b phosphoric acid (3TMS) and c, d aspartic acid (3TMS), as well as clear differences between sample groups, e.g. e, f GABA, 4-aminobutyric acid (3TMS). Variation of processing methods [M1] to [M7] of an identical data set [L3] (a, c, e) is compared to variations between laboratories [L1] to [L3] with processing fixed to [M1] (b, d, f). Abbreviations HNN, KNL and TSN1 represent rice cultivars, numbers encode nitrogen regimes (Sect. 2.1.)
Fig. 6
Fig. 6
GC×GC–TOF/MS is expected to enhance routine metabolite profiling. An exemplary GC–TOF/MS Chromatogram (a) of the evaluated rice samples (Figs. 4, 5) is compared to the corresponding GC×GC–TOF/MS analysis (b). Total ion count (TIC) is plotted

References

    1. Beckmann M, Enot DP, Overy DP, Draper J. Representation, comparison, and interpretation of metabolome fingerprint data for total composition analysis and quality trait investigation in potato cultivars. Journal of Agricultural and Food Chemistry. 2007;55(9):3444–3451. doi: 10.1021/jf0701842. - DOI - PubMed
    1. Biais B, Allwood JW, Deborde C, Xu Y, Maucort M, Beauvoit B, Dunn WB, Jacob D, Goodacre R, Rolin D, Moing A. 1H-NMR, GC-EI-TOF/MS, and dataset correlation for fruit metabolomics: Application to spatial metabolite analysis in melon. Analytical Chemistry. 2009;81(8):2884–2894. doi: 10.1021/ac9001996. - DOI - PubMed
    1. Catchpole GS, Beckman M, Enot DP, Mondhe M, Zywicki B, Taylor J, Hardy N, Smith A, King RD, Kell DB, Fiehn O, Draper J. Hierarchical metabolomics demonstrates substantial compositional similarity between genetically modified and conventional potato crops. Proceedings of the National Academy of Sciences. 2005;102:14458–14462. doi: 10.1073/pnas.0503955102. - DOI - PMC - PubMed
    1. Daub CO, Kloska S, Selbig J. MetaGeneAlyse: Analysis of integrated transcriptional and metabolite data. Bioinformatics. 2003;17:2332–2333. doi: 10.1093/bioinformatics/btg321. - DOI - PubMed
    1. Vos CHR, Moco S, Lommen A, Keurentjes JJB, Bino RJ, Hall RD. Untargeted large-scale plant metabolomics using liquid chromatography coupled to mass spectrometry. Nature Protocols. 2007;2(4):778–791. doi: 10.1038/nprot.2007.95. - DOI - PubMed

LinkOut - more resources