. 2010 Apr 1;5(4):e9937.
doi: 10.1371/journal.pone.0009937.

Targeting of de novo DNA methylation throughout the Oct-4 gene regulatory region in differentiating embryonic stem cells

Affiliations

Targeting of de novo DNA methylation throughout the Oct-4 gene regulatory region in differentiating embryonic stem cells

Rodoniki Athanasiadou et al. PLoS One. .

Abstract

Differentiation of embryonic stem (ES) cells is accompanied by silencing of the Oct-4 gene and de novo DNA methylation of its regulatory region. Previous studies have focused on the requirements for promoter region methylation. We therefore undertook to analyse the progression of DNA methylation of the approximately 2000 base pair regulatory region of Oct-4 in ES cells that are wildtype or deficient for key proteins. We find that de novo methylation is initially seeded at two discrete sites, the proximal enhancer and distal promoter, spreading later to neighboring regions, including the remainder of the promoter. De novo methyltransferases Dnmt3a and Dnmt3b cooperate in the initial targeted stage of de novo methylation. Efficient completion of the pattern requires Dnmt3a and Dnmt1, but not Dnmt3b. Methylation of the Oct-4 promoter depends on the histone H3 lysine 9 methyltransferase G9a, as shown previously, but CpG methylation throughout most of the regulatory region accumulates even in the absence of G9a. Analysis of the Oct-4 regulatory domain as a whole has allowed us to detect targeted de novo methylation and to refine our understanding the roles of key protein components in this process.


Conflict of interest statement

Competing Interests: The authors have declared that no competing interests exist.

Figures

Figure 1
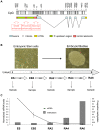
Figure 1. Acquisition of DNA methylation within the upstream regulatory region of the mouse Oct-4 gene.
A) Schematic diagram of the Oct-4 upstream regulatory region. B) Outline of the protocol for ES cell in vitro differentiation. C) Expression and methylation profiling of Oct-4 during in vitro differentiation of wildtype ES cells. The expression is the average of four independent experiments and the error bars show ± the standard error of the mean. Methylation values are the average for the entire upstream region (see detailed bisulfite results in Figure 2).
Figure 2
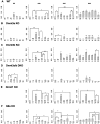
Figure 2. Time-course of DNA methylation across the upstream regulatory region of Oct-4 during in vitro differentiation.
Convergent arrowheads indicate the position of the primer pairs and solid lines the segments analysed. Each differentiation stage is indicated at the left with the corresponding methylation data to its right. Empty and filled circles denote unmethylated and methylated CpGs, respectively. Each horizontal row of circles represents one sequenced DNA clone. The single asterisked CpG indicates the HpyCh4 IV recognition site and the double asterisked CpG indicates the RARE that is always protected (see text).
Figure 3
Figure 3. Altered DNA methylation in differentiating ES cells lacking proteins implicated in de novo methylation.
The y-axis shows the ratio of methylated CpGs versus all CpGs in each segment. The differentiation stages are shown above each column and genotypes are indicated on the left. ND, not determined. The error bars show the standard error of the mean and asterisks denote the p-value calculated using the Exact Wilcoxon test. Only significant values according to the Wilcoxon permutation test are shown using the following convention: *, p<0.05; **, p<0.01; ***, p<0.001. Similar trends in pairwise statistical significance were summarized by asterisks above a single bar. In these cases only the lowest p value of all pairwise comparisons is shown. A detailed list of the pairwise comparisons that have been summarized in this figure is found in the Text S1.
Figure 4
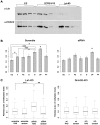
Figure 4. Nearest neighbour DNA methylation analysis reveals a defect in Lsh-deficient ES cells.
(A) Western blot of the parental wt ES cell line, as well as the scramble and Lsh KD cell lines used in this study. TOP: anti-LSH antibody, BOTTOM: loading control, anti-HDAC2 antibody (B) DNA methylation levels in each segment of the Oct-4 regulatory region in cells harboring the specific construct against Lsh (siRNA) or a scrambled control (scramble). The RA6 time point was analyzed. Annotation is as Figure 3. The asterisks above DP in both bar plots are against all other segments. (C) Box plots of the standard deviations of the methylation levels of neighboring CpGs. The statistical analysis was performed with the Wilcoxon test.

References

    1. Eckhardt F, Lewin J, Cortese R, Rakyan VK, Attwood J, et al. DNA methylation profiling of human chromosomes 6, 20 and 22. Nat Genet. 2006;38:1378–1385. - PMC - PubMed
    1. Weber M, Hellmann I, Stadler MB, Ramos L, Paabo S, et al. Distribution, silencing potential and evolutionary impact of promoter DNA methylation in the human genome. Nat Genet. 2007;39:457–466. - PubMed
    1. Khulan B, Thompson RF, Ye K, Fazzari MJ, Suzuki M, et al. Comparative isoschizomer profiling of cytosine methylation: The HELP assay. Genome Research. 2006;16:1046–1055. - PMC - PubMed
    1. De Bustos C, Ramos E, Young JM, Tran RK, Menzel U, et al. Tissue-specific variation in DNA methylation levels along human chromosome 1. Epigenetics Chromatin. 2009;2 - PMC - PubMed
    1. Illingworth R, Kerr A, DeSousa D, J√∏rgensen H, Ellis P, et al. A Novel CpG Island Set Identifies Tissue-Specific Methylation at Developmental Gene Loci. PLoS Biol. 2008;6:e22. - PMC - PubMed

Publication types

Substances