. 2010 Apr 1;5(4):e9943.
doi: 10.1371/journal.pone.0009943.

Cardiogenic induction of pluripotent stem cells streamlined through a conserved SDF-1/VEGF/BMP2 integrated network

Affiliations

Cardiogenic induction of pluripotent stem cells streamlined through a conserved SDF-1/VEGF/BMP2 integrated network

Anca Chiriac et al. PLoS One. .

Abstract

Background: Pluripotent stem cells produce tissue-specific lineages through programmed acquisition of sequential gene expression patterns that function as a blueprint for organ formation. As embryonic stem cells respond concomitantly to diverse signaling pathways during differentiation, extraction of a pro-cardiogenic network would offer a roadmap to streamline cardiac progenitor output.

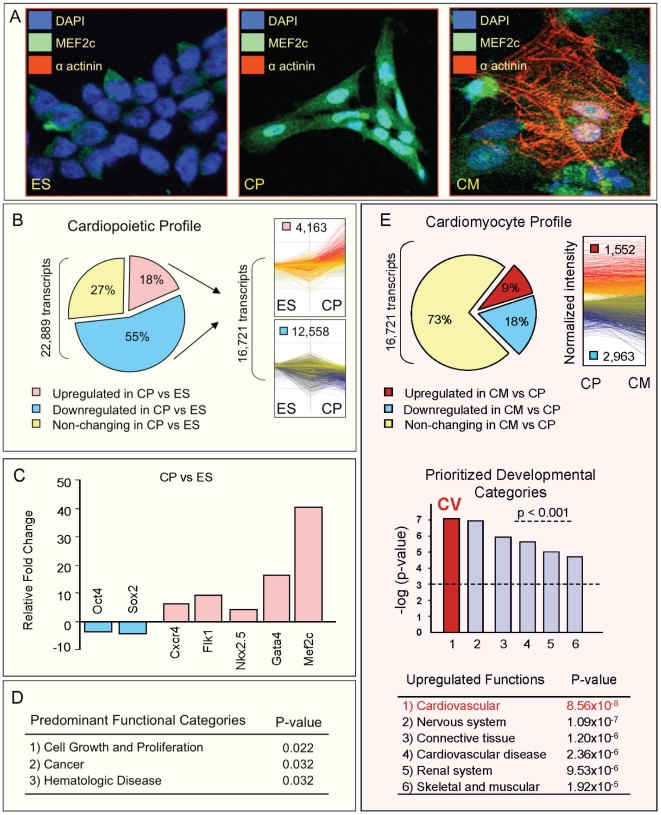
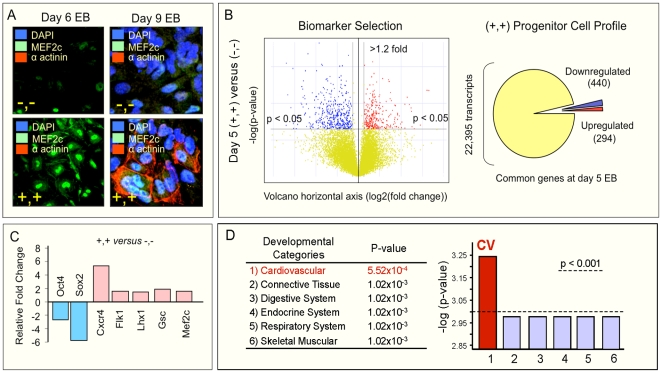
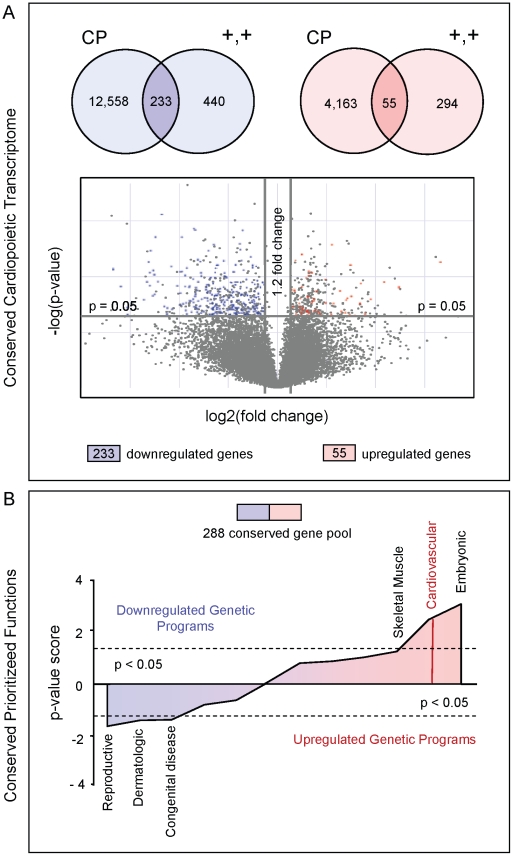
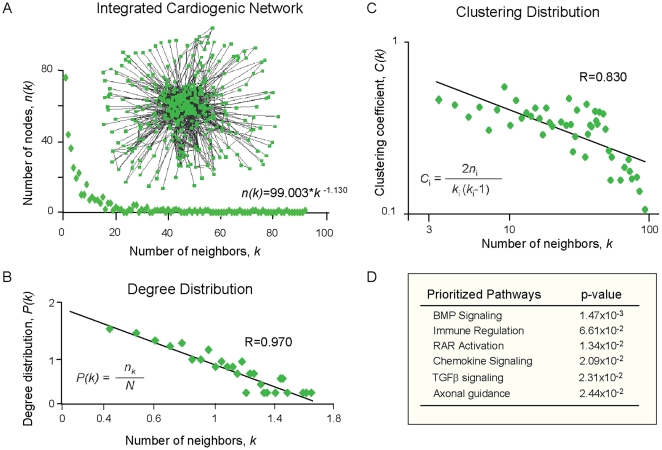
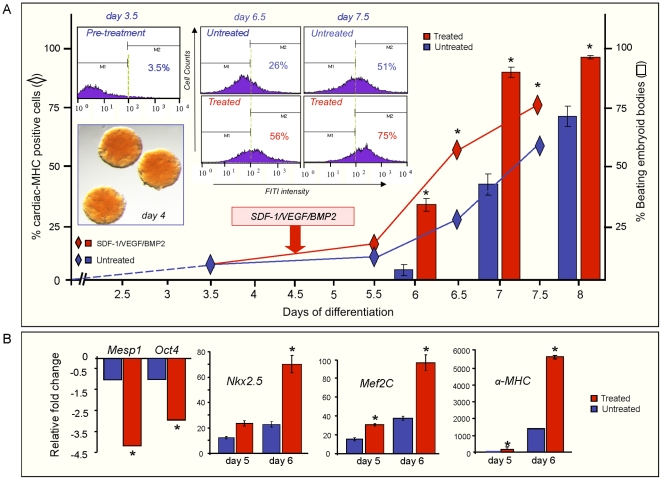
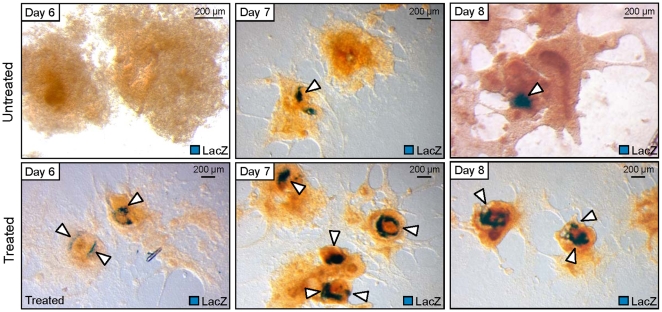
Methods and results: To resolve gene ontology priorities within precursor transcriptomes, cardiogenic subpopulations were here generated according to either growth factor guidance or stage-specific biomarker sorting. Innate expression profiles were independently delineated through unbiased systems biology mapping, and cross-referenced to filter transcriptional noise unmasking a conserved progenitor motif (55 up- and 233 down-regulated genes). The streamlined pool of 288 genes organized into a core biological network that prioritized the "Cardiovascular Development" function. Recursive in silico deconvolution of the cardiogenic neighborhood and associated canonical signaling pathways identified a combination of integrated axes, CXCR4/SDF-1, Flk-1/VEGF and BMP2r/BMP2, predicted to synchronize cardiac specification. In vitro targeting of the resolved triad in embryoid bodies accelerated expression of Nkx2.5, Mef2C and cardiac-MHC, enhanced beating activity, and augmented cardiogenic yield.

Conclusions: Transcriptome-wide dissection of a conserved progenitor profile thus revealed functional highways that coordinate cardiogenic maturation from a pluripotent ground state. Validating the bioinformatics algorithm established a strategy to rationally modulate cell fate, and optimize stem cell-derived cardiogenesis.


Conflict of interest statement

Competing Interests: The authors have declared that no competing interests exist.

Figures

Figure 1
Figure 1. Heterogeneity of a primitive cardiac progenitor transcriptome precludes prioritization of cardiac pathways.
(A) TNF-α guided differentiation of pluripotent embryonic stem cells (ES) facilitated generation of cardiopoietic (CP) progenitors, marked by nuclear internalization of Mef2C. Differentiated cardiomyocytes (CM) co-expressed nuclear Mef2C and sarcomeric α-actinin. (B) The cardiopoietic transcriptional profile encompassed 16,721 genes differentially expressed in CP versus ES. The signature CP transcriptome profile was defined here as a composite of significantly changed gene levels (≥20%, p<0.05) compared to the ES source. Blue, down-regulated genes; Red, up-regulated genes; Yellow, non-changing genes. (C) RT-PCR confirmed microarray predicted trends for selected transcripts. Blue, down-regulated genes; Red, up-regulated genes. (D) Ingenuity functional analysis prioritized generic developmental categories within the rich transcriptional profile of cardiopoietic (CP) cells. (E) Upper – Differentiated cardiomyocytes (CM) were distinguished from CP counterparts by 4,515 differentially expressed genes. Blue, down-regulated genes; Red, up-regulated genes; Yellow, non-changing genes. Lower – Within CM-specific transcripts, “Cardiovascular Development” (p = 8.56×10⁻⁸, highlighted in red in histogram) was prioritized among all other upregulated developmental programs.
Figure 2
Figure 2. CXCR4/Flk-1 biomarker signature enriches for cardiac progenitors.
(A) Sorted double positive (+,+) and double negative (−,−) cells were tracked for phenotypic differentiation in culture. Double positive cells displayed Mef2C nuclear localization at day 6 and expressed sarcomeric α-actinin at day 9 (lower panels). Double negative cells did not express markers of cardiac differentiation (upper panels). (B) Volcano plot analysis of gene expression data from double positive cardiac progenitors revealed significant differences compared to day 5 double negative cohorts. Red dots, differentially up-regulated transcripts (≥20% fold change, p<0.05); blue dots, down-regulated transcripts (≥20% fold change, p<0.05); yellow dots, shared transcriptome at day 5 embryoid bodies, independent of CXCR4/Flk-1 biomarker expression. (C) RT-PCR confirmed microarray predicted gene expression trends for selected transcripts. Blue, down-regulated, Red, up-regulated. (D) Ingenuity functional analysis of the double positive progenitor transcriptome revealed an ontologic prioritization (1) of “Cardiovascular Development” (p = 5.52×10⁻⁴), compared to other physiological systems (2–6).
Figure 3
Figure 3. Transcriptome intersection of cardiopoietic and double positive progenitors uncovers a conserved cardiac signature.
(A) Upper – Venn diagrams revealed a common transcriptome pool of 55 up-regulated and 233 down-regulated genes that represented similarly changing genes in cardiopoietic (CP) and double positive (+,+) cells. Lower – Volcano plot analysis of the double positive progenitor cell transcriptome (grey), overlaid with up-regulated (red dots) and down-regulated (blue dots) transcripts shared with CP. (B) In silico gene ontology analysis of the common progenitor transcriptome revealed persistent functional prioritization of “Cardiovascular Development”. Developmental categories are plotted according to a p-value score calculated to represent a weighted ontologic functional prioritization within the integrated 288 gene pool, i.e., p-value score  =  -log(p-value-Upregulated List) - (-log(p-value-Downregulated List). Red (positive y-axis) designates overall upregulated developmental programs within the integrated transcriptome, while blue (negative y-axis) designates overall downregulated developmental programs.
Figure 4
Figure 4. Conserved gene expression between progenitor transcriptomes extracts a network with quantifiable topology.
(A) Ingenuity built an integrated cardiogenic scaffold of 363 molecules (i.e., network nodes) connecting the 288 progenitor shared genes and their direct, database predicted biological partners. Cytoscape interaction analysis decoded 1801 direct molecular relationships (i.e., network edges). X-axis represents the number of neighbors, k, for each network node. Y-axis, n(k), represents the number of nodes with k neighbors and follows a power-law equation, with the majority of nodes having few connections and several highly connected nodes. The average calculated degree of the network, i.e., average number of neighbors for each gene (k) was 9.5. (B) The degree distribution, P(k), established a linear correlation (R = 0.970) on the log-log scale with the number of neighbors, k, a feature characteristic of scale-free networks. (C) The clustering coefficient, C(k), was calculated according to the inset formula, and correlated (R = 0.830) on a log-log scale with the number of neighbors, k. A linear logC(k) distribution denotes the hierarchical nature of the network. (D) The prioritized canonical pathways within the integrated network included BMP2, CXCR4/chemokine and TGFβ signaling.
Figure 5
Figure 5. Prioritization of network hubs for cardiogenic induction.
(A) A neighborhood of genes, cross-referenced with the Mouse Genome Informatics (MGI) knockout-based cardiac phenotype database, was independently established by Ingenuity as the most prioritized sub-network of the integrated cardiogenic framework. Nodes in the network are pink (upregulated pro-cardiac genes) or yellow (database-predicted direct interacting genes). Hubs are defined as highly connected nodes (genes) outlined in the network by colored circles. (B) Local module connectivity was defined for each of the network hubs as the total number of node connections they establish. (C) A relative pathway connectivity score (red, line graph) was calculated for the upregulated pro-cardiac genes, defined as the ratio of the number of hubs each cardiac gene is connected to over the total number of hubs available in the sub-network. (D) The integrated signaling model predicts the behavior of the network in the context of a triple treatment that would collectively target all integrating signaling highways. Co-stimulation of the SDF-1/CXCR4, VEGF/Flk-1 and BMP2/BMP2r axes is predicted to simultaneously activate all network hubs and empirical cardiac genes. Biological output will be quantified via nuclear transcription factors (i.e., Mef2C) and reporter assays (cardiac-MHC–Lac Z) as surrogates for de facto cardiogenic specification.
Figure 6
Figure 6. Targeted treatment with SDF-1/VEGF/BMP2 increases cardiogenic yield.
(A) α-MHC R1 embryonic stem cells were differentiated by the hanging drop method. Baseline embryoid body (EB) beating activity (columns) and FACS-gal α-MHC positive cell embryoid body composition (diamonds) were quantified (blue). Floating EBs (inset) transferred to gelatinized 6 well plates in the evening of day 4 were treated with SDF-1 (100 ng/mL), VEGF (10 ng/mL), and BMP2 (10 ng/mL) or differentiation media alone at Day 4.5. EBs were collected each day for FACS-gal analysis, RT-PCR and X-gal staining. Beating activity was recorded daily for each treatment condition for ∼300 EBs. Beating activity is represented by columns (blue for baseline, red for treatment), % cardiac-MHC-Lac Z positive cells are represented by diamonds (blue, red respectively). (B) RT-PCR analysis for selected pluripotency (Oct4), pre-cardiac mesoderm (Mesp1) and canonical cardiac (Nkx2.5, MEF2C, cardiac-MHC) transcripts. Red bars represent treatment with SDF-1, VEGF and BMP2; blue bars represent the baseline, untreated condition.
Figure 7
Figure 7. Augmentation of cardiac phenotype from pluripotent stem cells.
X-gal stained embryoid bodies show early enrichment in cardiac-MHC-LacZ expressing areas (blue staining) after 2 days of treatment (Day 6). On subsequent days, treated EBs consistently showed upregulation in cardiac-MHC-LacZ expressing areas compared to untreated controls. Arrows indicated cardiac-MHC-LacZ expressing areas.

Similar articles

Cited by

References

    1. Rosenthal N. Prometheus's vulture and the stem-cell promise. N Engl J Med. 2003;349:267–274. - PubMed
    1. Slack JM. Origin of stem cells in organogenesis. Science. 2008;322:1498–1501. - PubMed
    1. Gurdon JB, Melton DA. Nuclear reprogramming in cells. Science. 2008;322:1811–1815. - PubMed
    1. Murry CE, Keller G. Differentiation of embryonic stem cells to clinically relevant populations: lessons from embryonic development. Cell. 2008;132:661–680. - PubMed
    1. Nelson TJ, Behfar A, Terzic A. Stem cells: biologics for regeneration. Clin Pharmacol Ther. 2008;84:620–623. - PubMed

Publication types